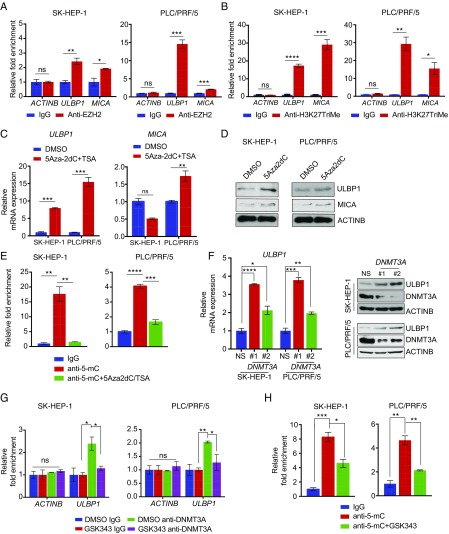
Fig. 6.
ULBP1 is repressed by EZH2 in a DNMT3A-mediated DNA methylation-dependent manner. (A) SK-HEP-1 or PLC/PRF/5 cells were analyzed for EZH2 recruitment on the ULBP1 or MICA promoter by ChIP analysis. The ACTINB promoter was used as a negative control. The ChIP results are shown as fold-change relative to the IgG control. (B) SK-HEP-1 or PLC/PRF/5 cells were analyzed for the H3K27TriMe mark on the ULBP1 or MICA promoter by ChIP analysis. The ACTINB promoter was used as a negative control. The ChIP results are shown as fold-change relative to the IgG control. (C) SK-HEP-1 or PLC/PRF/5 cells were treated with either DMSO or 5Aza2dC (5 μM) and TSA (1 μM) for 72 h. The expression of ULBP1 or MICA mRNA was analyzed by RT-qPCR. ULBP1 or MICA mRNA expression relative to DMSO-treated cells is shown. (D) SK-HEP-1 or PLC/PRF/5 cells were treated with either DMSO or 5Aza2dC (5 μM) and TSA (1 μM) for 72 h. The expression of the indicated proteins was analyzed by immunoblotting. (E) SK-HEP-1 or PLC/PRF/5 cells were treated with either DMSO or 3Aza2DC (5 μM) and TSA (1 μM) for 72 h. The ULBP1 promoter was analyzed for DNA methylation using the MeDIP method. The MeDIP results are shown as the fold-change in DNA methylation relative to IgG in either DMSO or 5Aza2dC+TSA-treated HCC cells. (F) SK-HEP-1 or PLCPRF/5 cells expressing either a NS shRNA or DNMT3A shRNAs were analyzed for ULBP1 mRNA expression (Left) or for the expression of the indicated proteins by immunoblotting (Right). (G) SK-HEP-1 or PLCPRF/5 cells were analyzed for DNMT3A recruitment on the ULBP1 promoter using a ChIP assay. The ACTINB promoter was used as a negative control. Relative fold-change compared with IgG is shown. (H) SK-HEP-1 or PLC/PRF/5 cells were treated with either DMSO or GSK343 (3 μM) for 48 h. The ULBP1 promoter was analyzed for DNA methylation using the MeDIP method. The MeDIP results are shown as fold-change in DNA methylation relative to IgG in either DMSO- or GSK343-treated HCC cells. Data are presented as mean ± SEM; ns, not significant; *P < 0.05; **P < 0.01; ***P < 0.001; and ****P < 0.0001.

