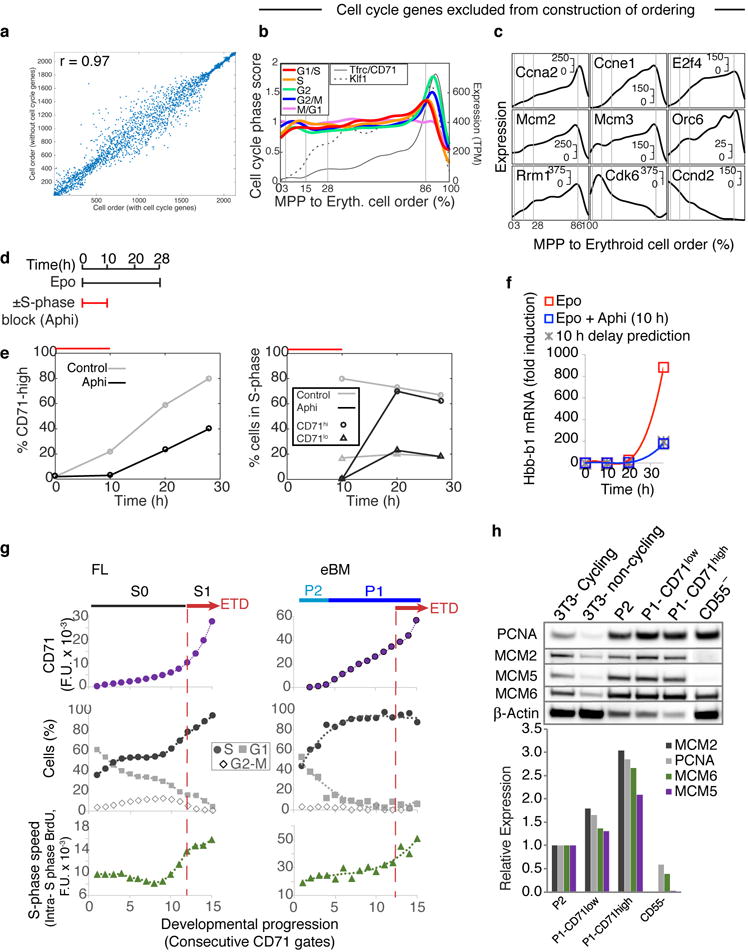
Extended Data Figure 10. Independence of cell ordering on cell cycle genes, and evidence of an S-phase dependent CEP-to-ETD transition in BM erythropoiesis.

a The computational ordering of cells from MPP to ETD is not sensitive to whether or not annotated cell cycle genes are included (cell ordering correlation is R=0.97).
b,c Reproduction of main text figure panels 6b,c after excluding cell cycle genes shows that the computationally inferred gene expression dynamics of cell cycle genes during EEP/CEP differentiation are not sensitive to whether or not annotated cell cycle genes are included in ordering cells.
d-f Activation of ETD is dependent on S phase. The experiment illustrated in e-f is representative of two independent experiments.
d Schematic illustration of experiments testing the link between S-phase progression and the CEP-to-ETD transition. BM Kit+Lin−CD71− cells were cultured in the presence of Epo for 28 hours, and either in the presence or absence of the DNA polymerase inhibitor Aphidicolin (Aphi) for the first 10 hours.
e BM Kit+Lin−CD71− cells require S phase in order to upregulate CD71, an initial event in ETD. Cells were treated as in (d); left: CD71hi cells fail to appear in the first 10 hours if cells are exposed to Aphi; they appear as soon as Aphi is removed from the medium. Right: cell cycle analysis of the same cells shows that Aphi prevented S phase progression during its presence in the culture medium; Aphi removal was followed by full recovery of S phase progression, with a high fraction of CD71hi cells in S phase. Representative of n=3 independent experiments.
f Aphi exposure for 10 hours delays induction of β-globin (Hbb-b1) by 10 hours. Representative of n= 2 independent experiments.
g CD71 expression (top row), cell cycle phase distribution (middle), and intra-S phase DNA synthesis rate (lower), for consecutive FACS gates of increasing CD71 in early stages of erythropoiesis from the fetal liver (left panel, representative of n= 4 independent experiments) and Epo-simulated bone marrow (right; n=2). See Fig. 6e,f for similar analysis in basal BM.
h Western blots (upper panel) and their quantification by densitometry (lower) showing an increase in S phase proteins during progression from EEP/P2 to early CEP (P1-CD71lo to late CEP (P1-CD71hi). Controls 3T3 cells were either cycling, or contact-inhibited (non-cycling), as indicated. Western blots are representative of n=3 independent experiments. For gel source data, see Supplementary Figure 1.
