
Figure 3. Predicted fate couplings confirmed by single cell fate assays.
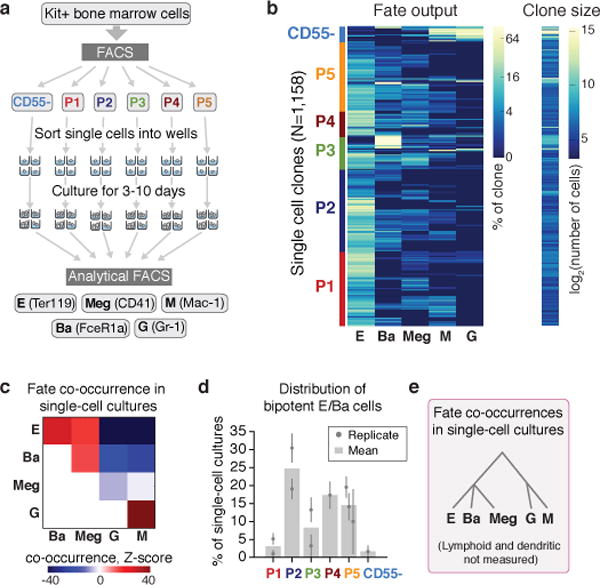
a Schematic of single cell liquid cultures, measuring clonal output with the indicated antibodies.
b Lineage output (left) and size (right) of each clone (rows) as in (a).
c Lineage co-occurrences in (b), computed by comparing the number of clones producing a pair of fates to the number expected following randomization.
d Fraction of bipotent erythroid-basophil (EBa) clones in P1-P5, containing E and Ba cells, but no other fates. Individual points and error bars show the expectation value and standard error from independent single cell sorting experiments. Bars represent the mean of n=two (P1, P2, P3) or n=three (P5) independent experiments; a single experiment was performed for P4 and CD55-.
e Cell state hierarchy based on fate co-occurrence in single-cell cultures.