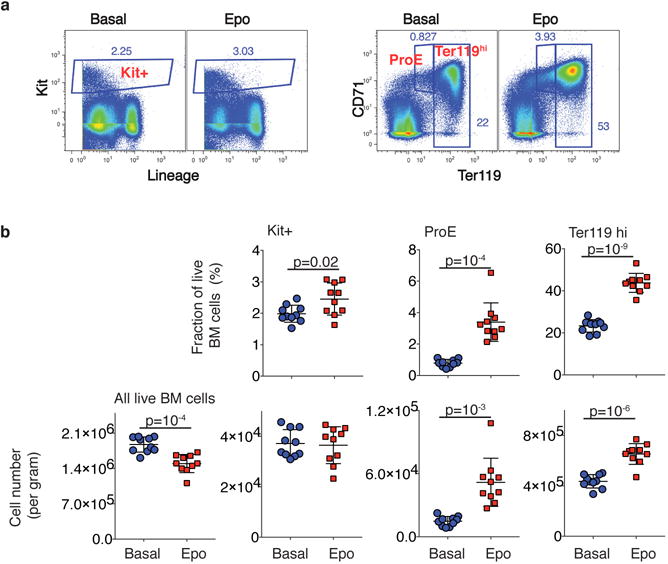
Extended Data Figure 7. Quantification of absolute Kit+ cell number in bone-marrow following in vivo administration of Epo.

a, b Adult female mice, eight weeks of age, were injected with either Epo (100 U/25 g) or saline (=basal), once per day for two days. Bone marrow was harvested at 48 hours. Viable (trypan blue negative) cells were counted using a TC20™ automated cell counter (BIORAD) and stained for Kit, Ter119 and CD71 and lineage markers. Data is from n=two independent experiments, with 5 mice analyzed individually in each group (basal or Epo) in each experiment.
a, Representative flow cytometric analysis of either basal or Epo-stimulated bone marrow, gating on Kit+ Lin− cells (left panels) or on proerythroblasts (ProE) and Ter119hi cells (right panels; ProE and Ter119hi cells are sequential stages of ETD).
b, Data summary (mean ± SD) for all mice (n= 10 for each group). Top panels show the fraction of all BM cells for each of the flow cytometric gates defined in (a). The lower panels show the absolute cell count in adult bone marrow for subsets defined as in each flow cytometric gate, or for the total number of bone-marrow cells. P values (2-tailed t test, unequal variance) are shown for all p<0.05.
