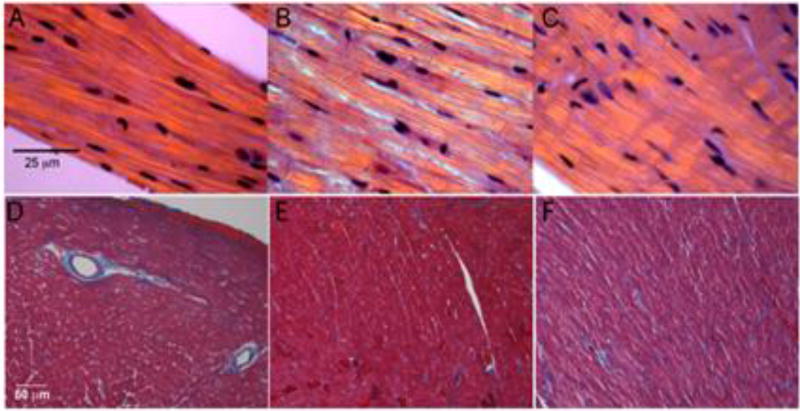
Figure 3.
Left Ventricular Histology. (A–C) Hematoxylin and eosin stain of cardiac left ventricular fibers under polarized light. (A) 6 month old Non-tg, (B) D230N-low, and (C) D230N-high mice. Line represents 25 µm. (D–F) Masson’s trichrome stain of sections from cardiac left ventricles. (D) Non-tg, (E) D230N-low, and (F) D230N-high mice. Line represents 50 µm.

