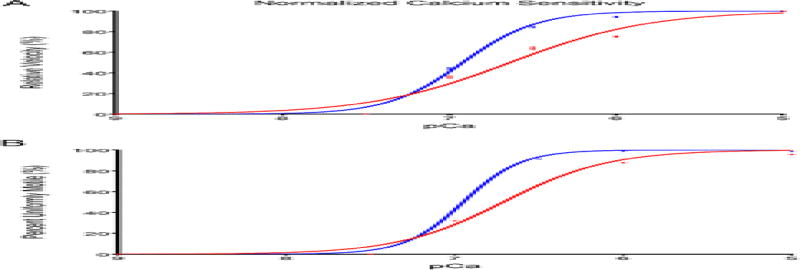
Figure 6.
Regulated-In Vitro Motility assays of filaments containing WT (blue) or D230N-Tm (red) at varying calcium concentrations showing the (top) normalized velocity of filament sliding as a function of pCa (bottom) percent uniformly motile filaments. Vmax values are reported as means of the filament sliding velocity at pCa 5. The EC50 and slope values were obtained from normalized fits of the Hill equation to mean filament speed at each pCa; 150 filaments per condition were analyzed. Values are expressed as mean ± S.E.M and summarized in Table 3. A student’s t test was used for statistical comparison. *** p < 0.001 relative to WT filaments.

