Figure 7.
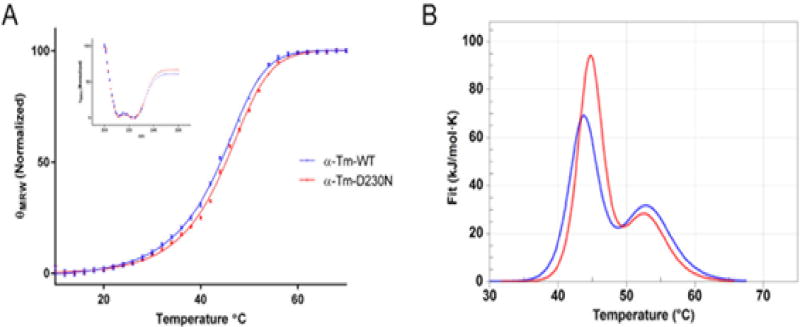
Thermal Stability and Structure of human WT and D230N-Tm assessed via CD and DSC. (A) The mean residue elipticity of 0.3 mg/mL WT (blue) and D230N (red) at 222 nm is graphed as a function of temperature. Inset: Spectra from 200 to 260 nm of WT and D230N-Tm at 20°C. n=3, each an average of 3–5 scans. Extra sum of squares F test and least squares fit analysis were used for statistical comparison of WT to D230N-Tm. (B) Thermal Stability of WT and D230N-Tm assessed via DSC. The heat capacity (kJ/mol*K) of 1.8 mg/mL WT (blue) and D230N (red) Tm is graphed as a function of temperature. Solid lines represent experimental fit after subtraction of baseline and instrumental background. The heating rate was 1°C/min from 20–70°C. Reported values were determined from the fit of the two curves (Van’t Hoff two-state model), one-way ANOVA was used to determine statistical significance. Values in Table 4 are reported as mean ± S.E.M **p < 0.01, ****p < 0.0001 compared to WT-Tm.

