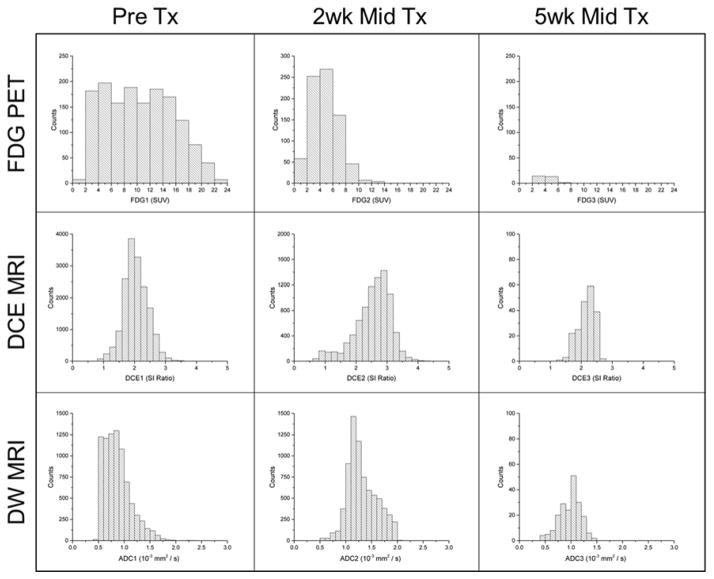
Figure 2.
Intensity histograms of FDG-PET SUV, DCE-MRI SI ratio, and DW-MRI ADC at time points prior to, 2 weeks during, and 5 weeks during external beam radiation therapy for the same patient as in Figure 1, from which quantitative features of heterogeneity can be extracted. Note the variable histogram shapes and distributions between modalities and across time points. This patient is characterized by increasing FDG-PET SUV skewness, decreasing DCE-MRI SI ratio skewness, and decreasing DW-MRI ADC skewness with therapy.

