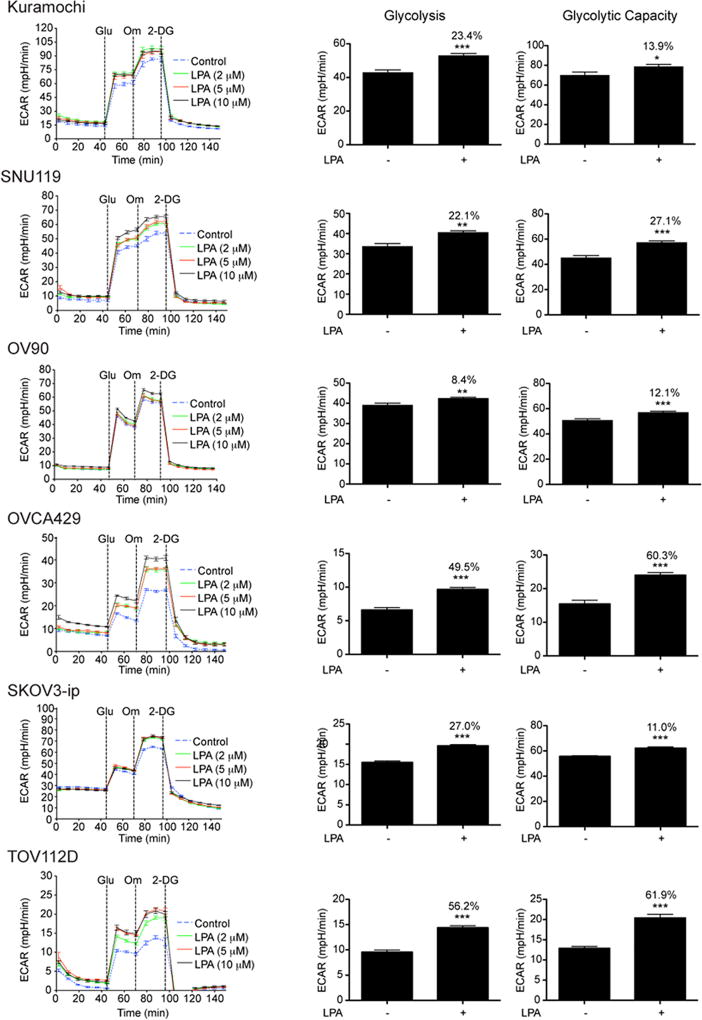
Figure 1. LPA stimulates aerobic glycolysis in ovarian cancer cells.
Serum-starved ovarian cancer cell lines, Kuramochi, SNU119, OV90, OVCA-429, SKOV3-ip, and TOV112D were stimulated 2, 5, and 10 µM concentration of LPA for 6 h and ECAR was determined using XFe96 extracellular flux analyzer. ECAR was measured every 8 minutes (Left Panel). Addition of glucose (10 mM), oligomycin (1 µM) and 2-DG (50 mM) were carried out at the indicated time-points. Rate of glycolysis and glycolytic capacity derived from the ECAR analysis with LPA-stimulation (10 µM) are presented as bar charts. Every experiment was repeated at least three times and the results are from a representative analysis. Error bars indicate mean ± SEM (n = 5 to 21parallel determinations). Percentile increases over the basal levels of glycolysis and glycolytic capacity are denoted above the bars of the chart. Statistical significance between LPA-treated and untreated cells was determined by Student’s t test (**P<0.005; ***P<0.0005).

