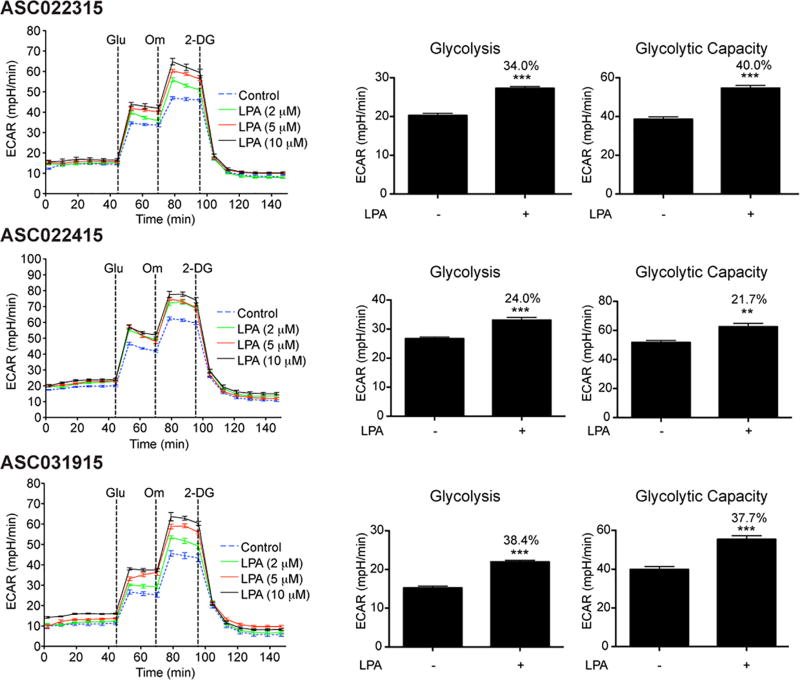
Figure 2. LPA induces aerobic glycolysis in patient-derived ovarian cancer cells.
Patient-derived ovarian cancer cells, ASC022315, AS022415, and ASC031915, were serum starved overnight and stimulated with 2, 5, and 10 µM LPA for 6 h. ECAR was determined every 8 minutes. The experiment was repeated thrice and the ECAR flux (Left Panel), glycolytic rate, and glycolytic capacity (Right Panel) from a typical experiment are presented. Error bars represent SEM of the mean values (n = 5 to 8 parallel determinations). Percentile increases over the basal levels of glycolysis and glycolytic capacity are denoted over the bars of the chart. Statistical significance was determined by Student’s t test (**P<0.005; ***P<0.0005).

