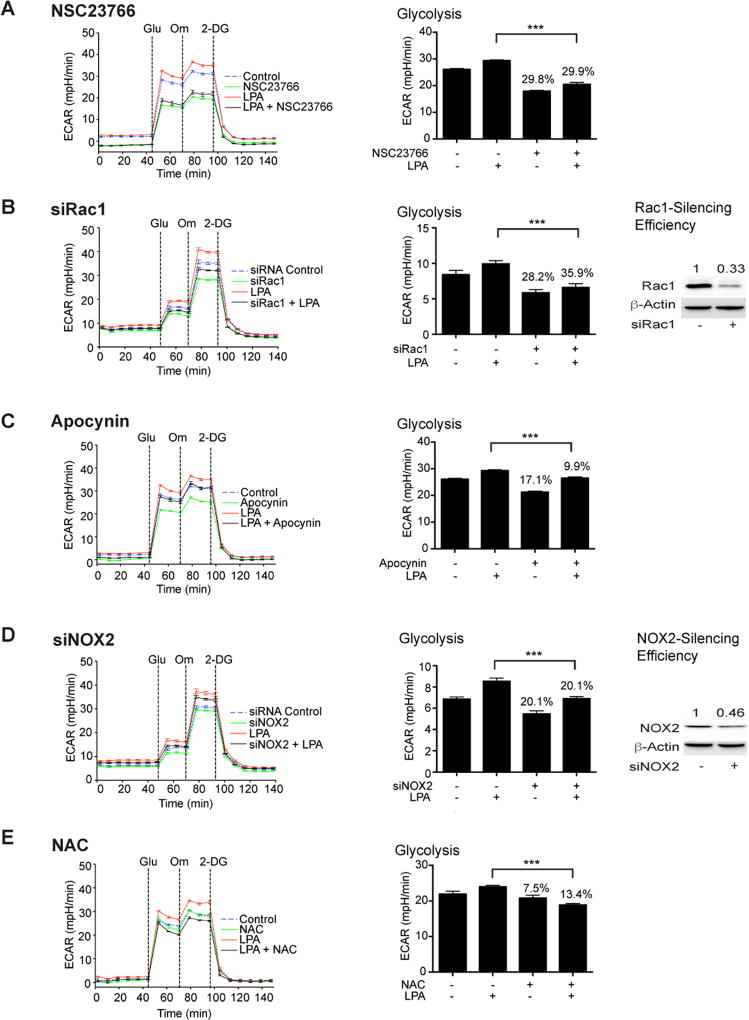
Figure 4. Regulation of glycolysis by LPA requires the Rac1-NOX-ROS network.
SNU119 cells were pretreated with 10 µM Rac1-inhibitor, NSC23766 (Panel A), 100 µM NOX-inhibitor, Apocynin (Panel C), or 10 µM ROS-scavenger, N-acetyl cysteine (Panel E) for 1 hr, following which they were stimulated with LPA (10 µM) for 6 h. ECAR flux and glycolytic rate were plotted. Representative analysis from a set of three independent experiments (mean ± SEM; n = 9 parallel determinations) is presented. Statistical significance was determined by Student’s t test (***P<0.0005). Percentile decreases over the basal levels of glycolytic rate are denoted above the bars of the histogram. For siRNA studies, OVCA429 cells were transfected with either siRNAs targeting Rac1 (Panel B), NOX2 (Panel D), or control non-targeting siRNAs for 48 hrs following which they were stimulated with 10 µM LPA for 6 h. ECAR flux over time and glycolytic rate were plotted. Results (mean ± SEM; n = 9 – 11 parallel determinations) from a representative analysis (n = 3 independent experiments) are presented along with statistical significance, determined by Student’s t test (***P<0.0005). Percentile decreases over the basal levels of glycolysis are marked above the bars of the histogram. Silencing efficiency was monitored by immunoblot analysis using antibodies to Rac1 or NOX2. Immunoreactive bands were quantified and the quantified expression values for Rac 1 (Panel B) and NOX2 (Panel D) are presented above the respective bands.

