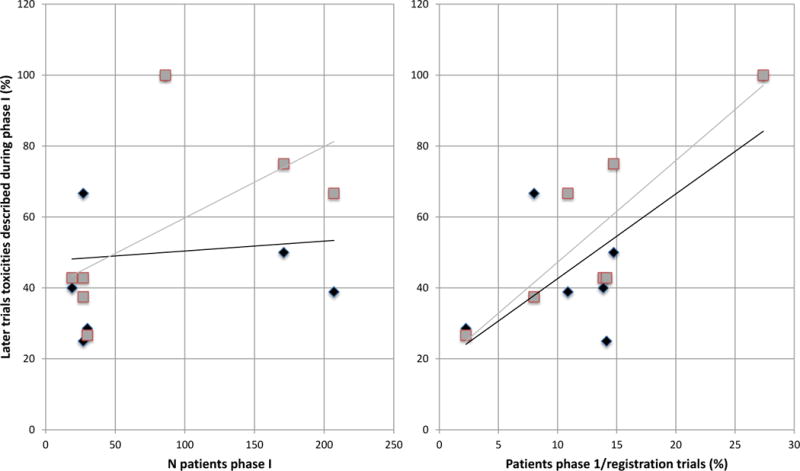
Figure 3.

Correlation between toxicities in phase I and in later trials.
Y axis is the types of toxicities described in phase I trials as a percent of the types of toxicities described in the registration trials.
Left panel: correlation between the number of patients included during the phase I trial and the description of all clinically significant toxicities (black diamond), as well as immune-related toxicities (gray square) from later trials. This panel shows that there is an increase in the ability to identify the immune-related toxicities as the number of patients in phase I increases. The number of patients in phase I did not, however, correlate with the ability to identify all types of clinically relevant toxicities.
Right panel: correlation between the ratio of patients included during phase I over patients included in registration trials and the description of clinically significant (black diamond) and immune-related toxicities (gray square) from later trials.
This panel shows that the ratio of the number of patients in phase I over the number of patients in the registration trial(s) correlated with the ability to identify either immune-related or all clinically relevant toxicities.
