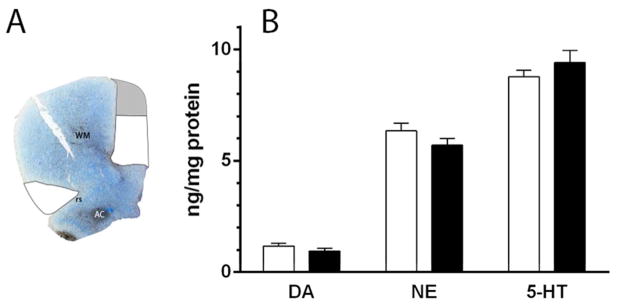
Figure 11.
(A) A toluidine blue-stained section illustrates dissected regions of the frontal cortices taken for analyses of monoamine concentrations. The dissected areas of the mPFC and OFC are depicted in white; the gray area in the medial precentral cortex of the mPFC was discarded. (B) Monoamine concentrations in the mPFC (white bars) and OFC (black bars). The concentrations of dopamine, norepinephrine, and serotonin in the mPFC and OFC did not differ significantly.

