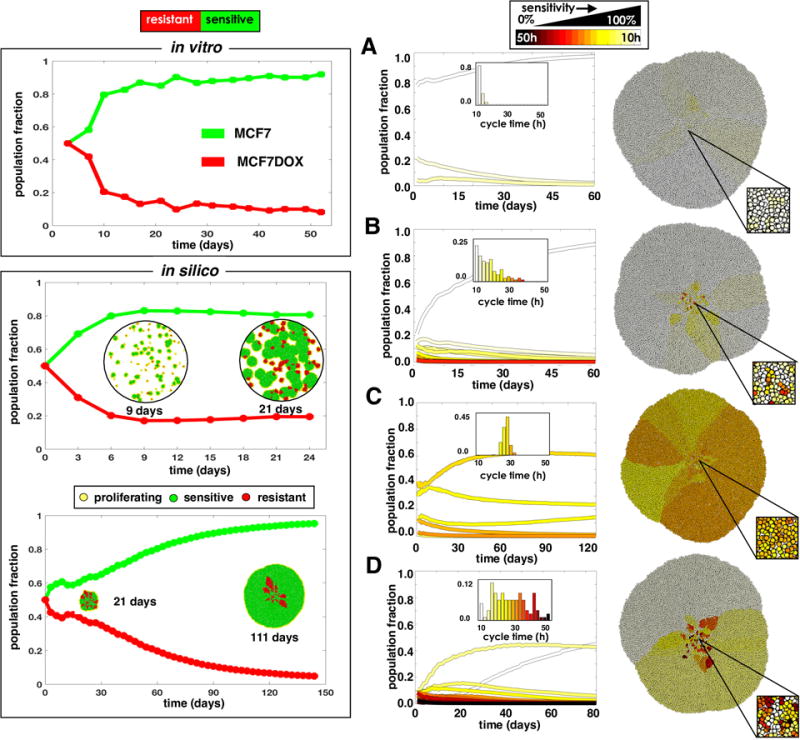
Figure 2.

Competition between sensitive and resistant cells using in vitro and in silico models. Binary sensitive and resistant populations (left) and populations with a spectrum of sensitivity (right) are considered. Top left: Cells sensitive (MCF7) and resistant (MCF7Dox) to doxorubicin are co-cultured in vitro and replated every 3-4 days. Lower left: An in silico co-culture of sensitive (40h cell cycle) and resistant (60h cell cycle) cells seeded randomly throughout the domain or clustered in the center. The spatial distributions of cells are shown at several time points. Right: In silico simulations were initialized with different phenotypic distributions, characterized by a mean sensitivity s and standard deviation σs: A) s=100%, σs=5%; B) s=100%, σs=25%; C) s=60%, σs=5%; and D) s=60%, σs =25%. The initial distributions are shown as histograms in the plot insert; the final spatial layout is shown to the right.
