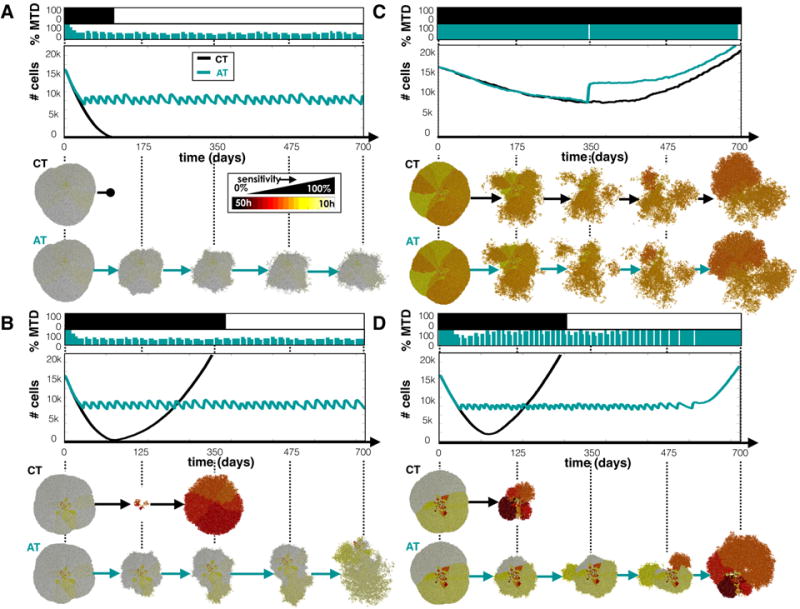
Figure 3.

CT and AT schedules applied to tumors with a variety of phenotypes. Tumor phenotypes were initialized by normal distributions with mean sensitivity s and standard deviation σs: A) s=100% and σs=5%, B) s=100% and σs=25%, C) s=60% and σs=5%, and D) s=60% and σs=25%. Top panels show the dose schedules for each treatment strategy, middle panels, the population dynamics, and lower panels, the spatial configurations at several time points.
