
Figure 7.
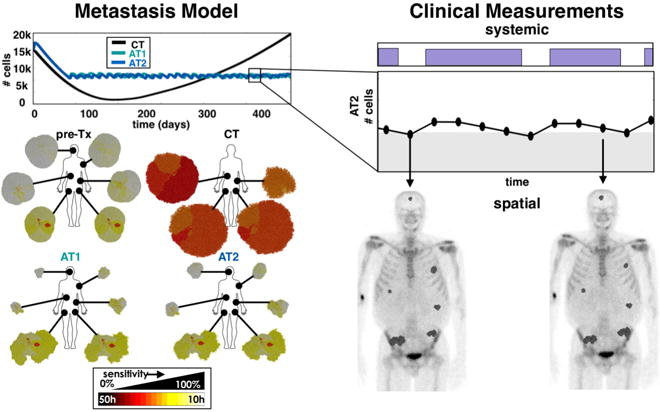
Connecting a set of tumors at the tissue scale to a systemic measure of tumor burden. A set of tumors with dissimilar compositions are treated using CT, AT1 (α=0.25, β=0.05), and AT2 (α=0.50, β=0.10) schedules using the change in the total tumor burden (the sum of tumor cells from all metastatic sites) to adjust treatment doses. The population dynamics (upper left), and the individual spatial compositions at the end of the simulation are shown (lower left). This model can be used to couple the total systemic tumor burden to the individual spatial distributions found from imaging (right).