
Figure 1. FINO2 induces ferroptotic cell death.
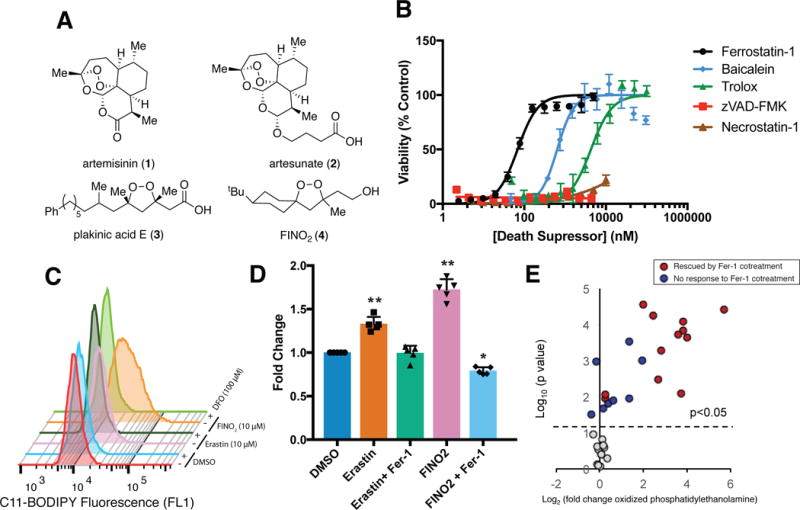
(A) Organic peroxides and FINO2 (B) The dose-dependent effect of cell death-suppressing compounds on ferroptosis triggered by FINO2 (10 μM) in HT-1080 cells. Viability measured 24 h after compound treatment. Experiments were performed with triplicate cell cultures. Data are plotted as the mean ± s.d., n=3. (C) Ability of iron chelator deferoxamine (DFO) to prevent ferroptosis-dependent C11-BODIPY oxidation when incubated together for 6 h. Three independent experiments were performed with similar results. (D) Ability of ferrostatin-1 (Fer-1) (2 μM) to prevent accumulation of thiobarbituric acid reactive substances (TBARS) when co-treated with erastin (5 μM) or FINO2 (10 μM) for 6 h. Data are plotted as the mean ± s.d., n=5. P values were determined using one-way ANOVA; *P=0.003, **P < 0.001 versus DMSO control. (E) Changes in oxidized phosphatidylethanolamine abundance as detected by LC-MS after treatment with FINO2 (10 μM) for 6 h. Individual lipid species are plotted based on their Log2 fold change in abundance (horizontal axis) and the statistical significance of the change (Log10 P-value) on the vertical axis. P values were determined using two-sided t test. Lipid species with significant change upon FINO2 treatment were plotted above the dot line (p<0.05). Experiments were performed in triplicate with biologically independent samples.