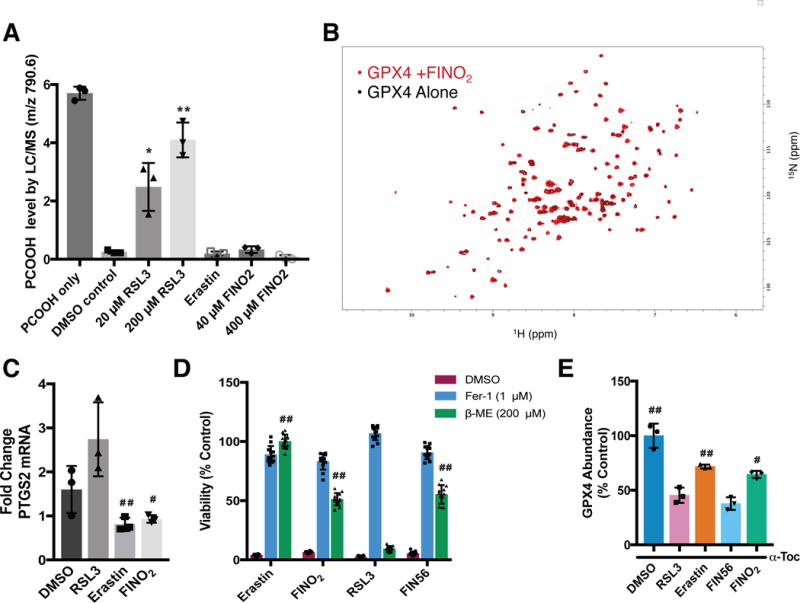
Figure 3. FINO2 indirectly inhibits GPX4 activity.

(A) Effect of ferroptosis inducers on GPX4 activity within the GPX4-containing cell lysates. Cell lysates were treated with PCOOH and GSH and the abundance of PCOOH was measured by LC-MS. Data are plotted as the mean ± s.d., n=3 biologically independent samples. *P=0.009, **P < 0.001 versus DMSO control (B) HSQC spectrum of GPX4 protein (black; 50 μM) overlaid with the spectrum of GPX4 incubated with FINO2 for 6 h (red; 50 μM and 500 μM, respectively) (C) PTGS2 mRNA levels following treatment with RSL3 (0.5 μM), erastin (10 μM), and FINO2 (10μM) for 6 h. Data are plotted as the mean ± s.d., n=3 biologically independent samples. #P=0.021, ##P=0.017 versus RSL3. (D) Ability of β-mercaptoethanol to prevent ferroptosis initiated by different ferroptosis inducers. Viability measured 24 h after co-treatment. Data are plotted as the mean ± s.d., n=12 biologically independent samples. ##P < 0.001 versus RSL3. (E) GPX4 protein abundance in HT-1080 cells co-treated with RLS3 (1 μM), erastin (10 μM), FIN56 (5 μM), or FINO2 (10 μM) and 100 μM α-tocopherol for 10 h, data are plotted as the mean ± s.d., n=3 biologically independent samples. #P=0.002, ##P<0.001 versus FIN56. Representative blot image is shown in Supplementary Figure 7. All P values were determined using unpaired two-tailed Student’s t-test.
