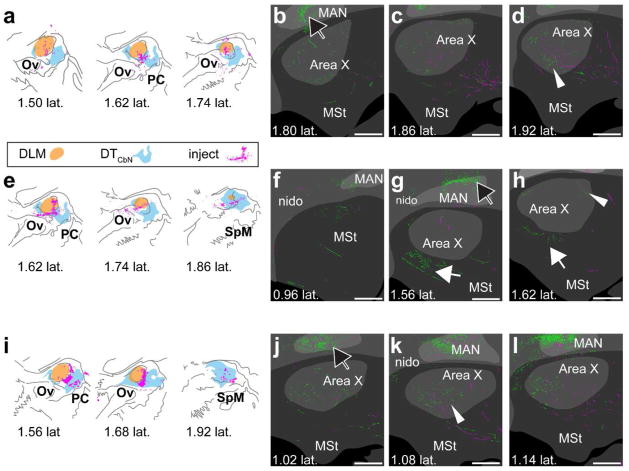
Figure 10.
DLM and adjacent DTCbN project to Area X. a–d, case where injection was mostly in DLM. Synaptophysin-GFP label was evident in Area X (for example see white arrowhead in d) e–h, case where injection was in DLM and surrounding DTCbN. Synaptophysin-GFP label was evident in medial striatum (G and H, white arrow) and in Area X (h, white arrowhead). i–l, case where injection was mostly in DTCbN. Although the injection was mainly in DTCbN, we again saw strong synaptophysin-GFP label in Area X (for example k, white arrowhead). a,e,y, Injection sites. Orange region, DLM; cyan region, DTCbN; magenta, cell bodies expressing mCherry. b–d, f–h, j–l. Series of sections from lateral to medial showing Area X, surrounding medial striatum, and overlying nidopallium. Green, GFP signal. Magenta, mCherry signal. Dark gray, no parvalbumin label; gray, some parvalbumin label; light gray, strong parvalbumin label. White arrowheads, examples of GFP signal in Area X; solid white arrow, GFP signal outside Area X in MSt; black arrow with white outline, GFP signal in nidopallium. DLM, dorsolateral thalamus, medial part. MAN, magnocellular nucleus of anterior nidopallium. MSt, medial striatum. nido, nidopallium. Ov, nucleus ovoidalis. PC, posterior commissure. SpM, medial spiriform nucleus. To facilitate comparison across cases, distances from midline for injection sites are based on the map of DLM and DTCbN we created as described in Methods. All sections are parasagittal, left is anterior and up is dorsal. All scale bars 500 μm.

