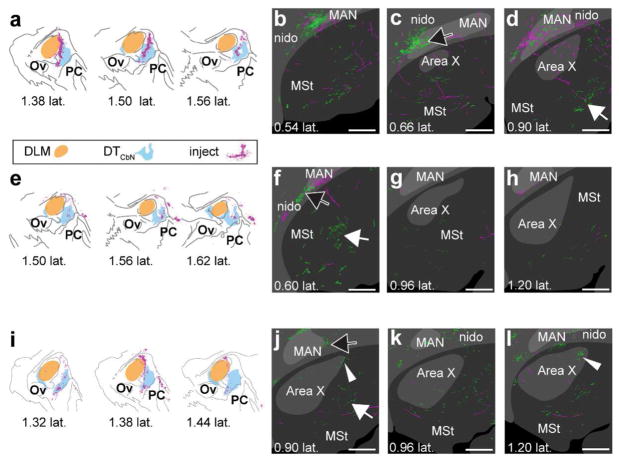
Figure 12. DLM sends a significant projection to Area X.
a, representative image of iontophoretic injection in DLM. b, injection site mapped onto borders of DLM and DTCbN as in Figs. 10 and 11, showing that it injection was confined to DLM. c–e, series of consecutive sections showing label from injection throughout Area X and in LMAN f–j, Axon segments dotted with varicosities as well as locally-ramifying axon-terminal like morphologies in Area X. Each panel is a confocal image of the area(s) surrounded by a white box in the panel above it. Ov, nucleus ovoidalis, PC, posterior commissure. Scale bars: a, c–e 500 μm. f–h, 50 μm. j, 100 μm.

