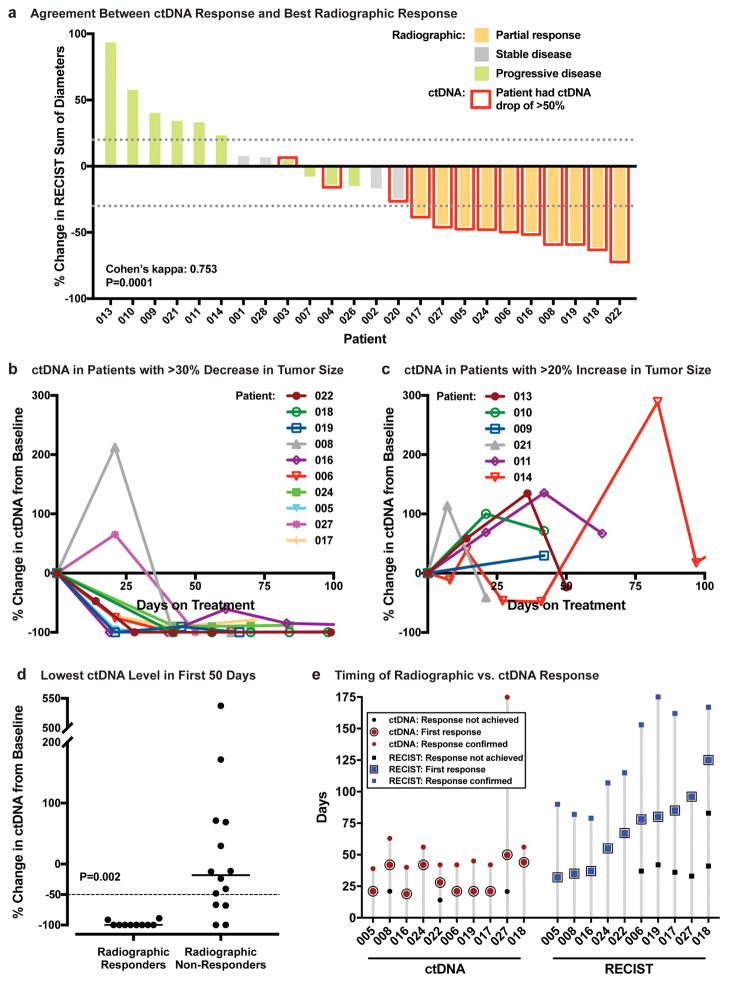
Figure 2. Concordance, Magnitude, and Timing of ctDNA and Radiographic Response to Immunotherapy.
A, Agreement of ctDNA response and best radiographic response, defined as the lowest ratio of [tumor burden on any post-baseline scan] to [tumor burden at baseline] (26) (n = 24 patients). Tumor burden was measured according to RECIST, version 1.1 (19). Red outline indicates patients who achieved a ctDNA response. Dotted lines indicate a 30% decrease or 20% increase in RECIST sum of diameters. B and C, Percentage change in ctDNA level from baseline during the first 100 days of immunotherapy among patients with at least a 30% decrease (B, n = 10) or a 20% increase (C, n = 6) in RECIST-defined tumor burden. D, Lowest ctDNA level (percentage change from baseline) measured within the first 50 days after initiation of immunotherapy, for patients who achieved radiographic partial response vs. those who did not. Each dot represents one patient (n = 24). The median value for each group is indicated by a horizontal line. A dashed line indicates a 50% decrease in ctDNA level, which is the threshold for ctDNA response. P=0.002 by Wilcoxon rank sum test. E, Time to radiographic vs. ctDNA response among patients who achieved both types of response (n = 10). Dates of ctDNA and radiographic measurements meeting response criteria are shown. Also shown are preceding time points that failed to meet response criteria as well as confirmatory measurements for both ctDNA and imaging.

