
Fig. 2.
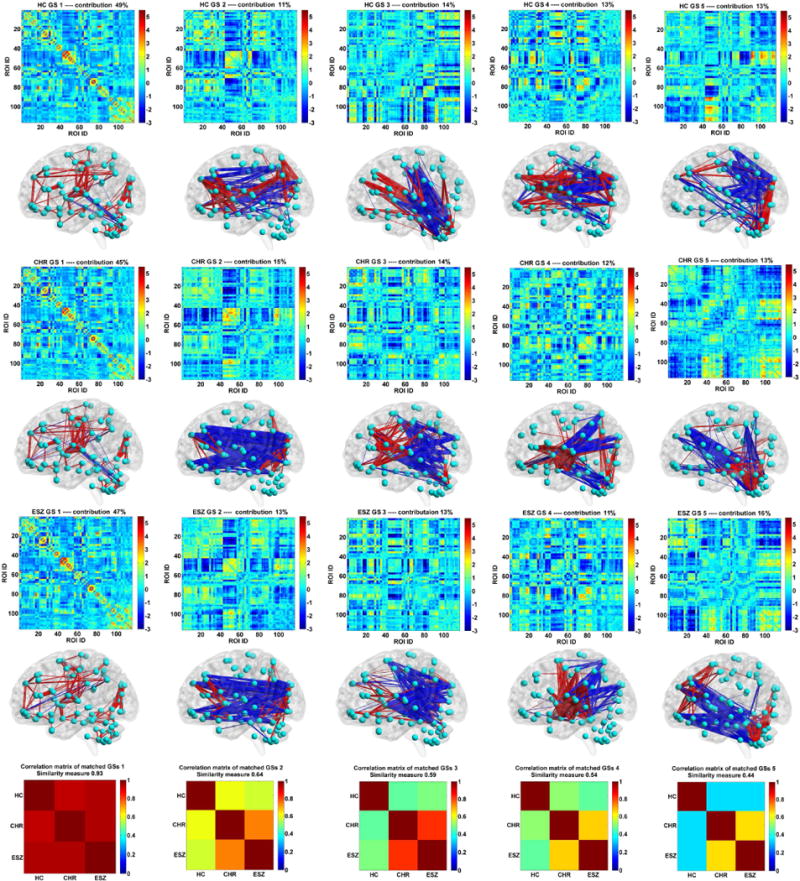
The corresponding group-level connectivity states (GSs) in matrix form, rendered form, and their inter-group correlations for healthy control (HC), clinical high-risk (CHR) and early illness schizophrenia (ESZ) groups. Each rendered GS is another view of the associated GS matrix, shown using the BrainNet Viewer toolbox with the same sparsity. The red and blue lines represent positive and negative values, respectively. The first column corresponds to the dominant GS. The last row shows the correlation matrix of three matched GSs from three groups. The overall similarity between the matched GSs is also shown along with each correlation matrix.