
Fig. 5.
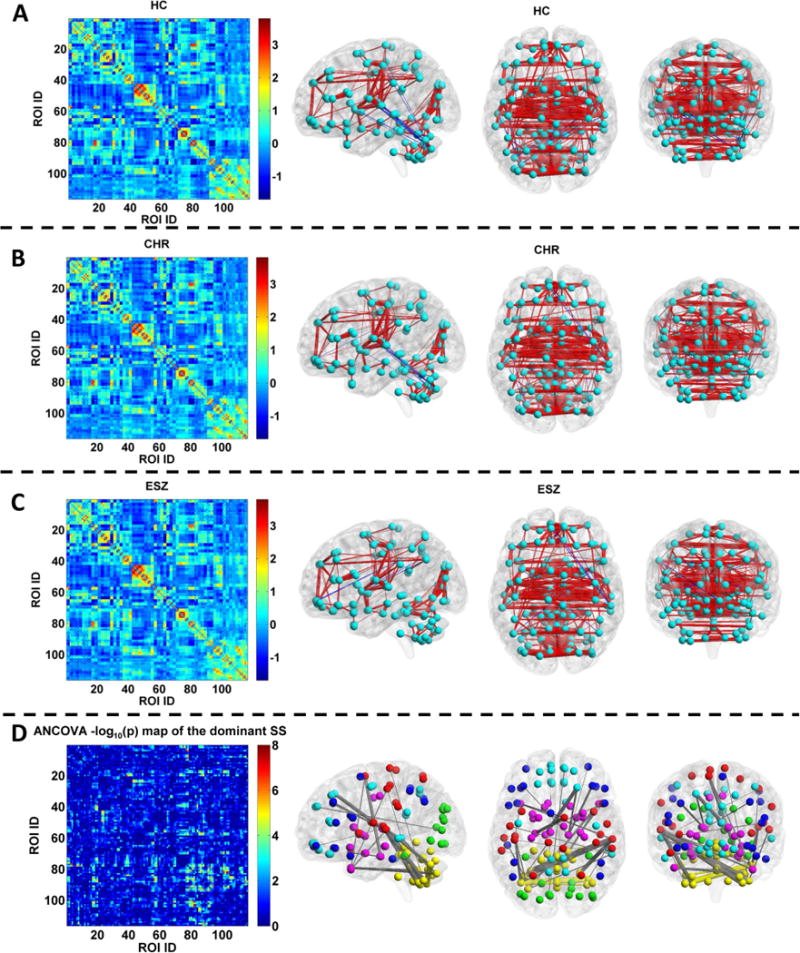
A–C: The functional connectivity matrix of the mean dominant subject-specific FC state (SS) across subjects and its visualized pattern for the healthy control (HC), clinical high-risk (CHR) and early illness schizophrenia (ESZ) group, respectively. In A–C, the red and blue lines represent the positive and negative strengths, respectively. D: Left: Statistical map (−log10 (p) values) obtained by performing analysis of covariance (ANCOVA) with age and gender as covariates on each connection in the dominant SSs of three groups. Right: The visualized pattern of the 30 FCs showing significant group difference (p < 0.05 with Bonferroni correction, i.e., p < 0.05/6670). The thickness of the line reflecting one edge reflects the associated F-value. The colors of the nodes and edges in the subfigure D are organized by their modules in the AAL template provided by the BrainNet Viewer software. Nodes belonging to the same module and edges linking such nodes are shown using the same color. Edges linking two nodes belonging to different modules are shown in grey color.