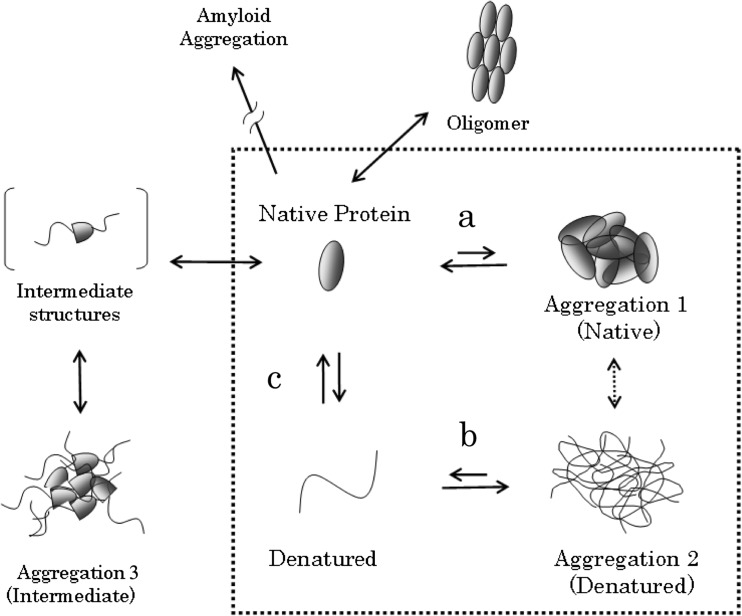
Fig. 1.
Conceptual diagram of protein aggregation. In this paper, we simplify our discussion by restricting it to the four states depicted within the dotted frame. Arrows a and b describe, respectively, the aggregation of natively folded and denatured (or unfolded) proteins. c describes the structural stability of proteins. In this review, we consider aggregation 1, 2 and 3 as “amorphous” aggregates. Diagram adapted with permission from Kato A. et al. [Seibutsu Butsuri, 48, 185–9 (2008), in Japanese: edited by the Biophysical Society of Japan]

