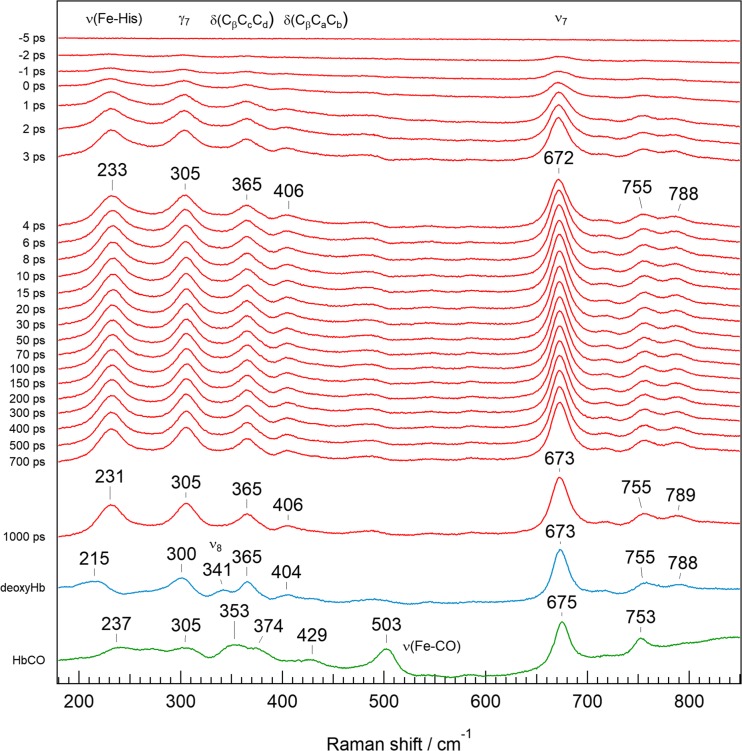
Fig. 9.
Pico-second time-resolved resonance Raman spectra of photodissociated HbCO in the 180–850 cm−1 region. Spectra of the equilibrated states of deoxyHb (blue) and HbCO (green) are depicted at the bottom for comparison (Mizutani and Nagai 2012). The time-resolved spectra (red) are differences of the spectrum observed for specific Δt against the spectrum of HbCO (green)

