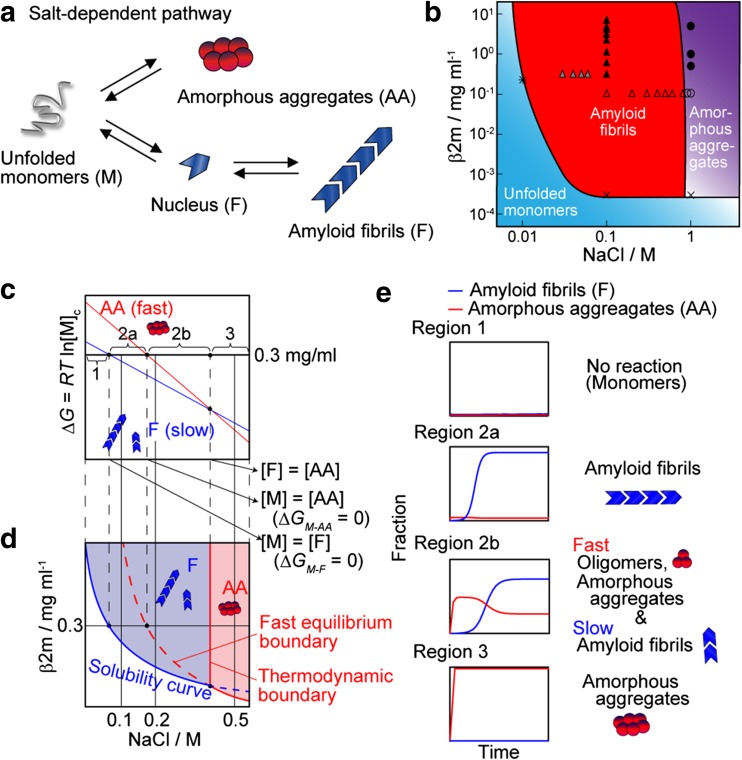
Fig. 5.
The competitive mechanism of amyloid fibrillation and amorphous aggregation (AA). a Schematic model. b Phase-diagram for the NaCl dependence of monomers, fibrils, and amorphous aggregates. Symbols indicate the experimental data to obtain the phase diagram; see Ikenoue et al. (2014) for details. Reproduced from Ikenoue et al. (2014), with permission. c, d Dependency on the NaCl concentration of free energy changes of amyloid fibrillation and amorphous aggregation and the predicted phase diagram. e Representative kinetics under Regions 1–3 as defined in c are illustrated. Reproduced from Adachi et al. (2015), with permission

