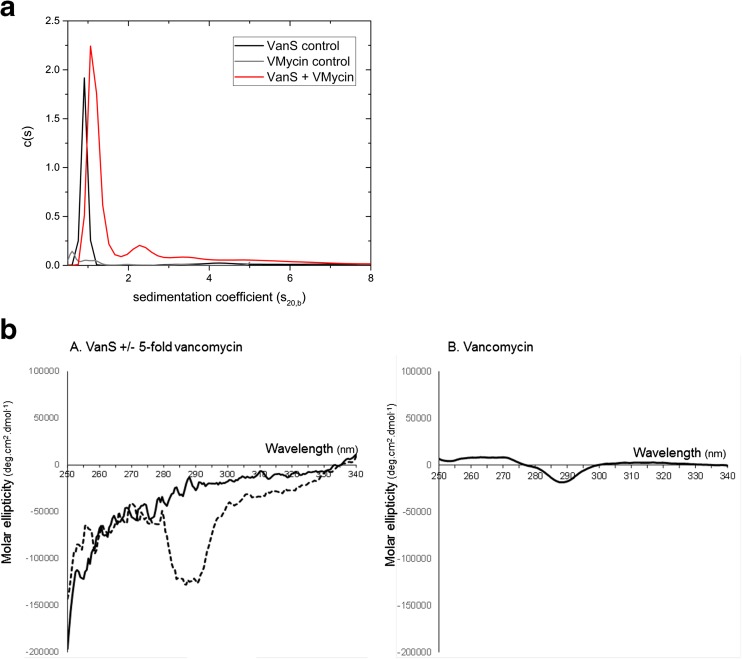
Fig. 5.
a Sedimentation coefficient concentration distribution, c(s) vs s20,b, (where s20,b is the sedimentation coefficient at 20.0 oC in buffer b) profile for intact VanS (5.4 μM) (black line) in HGN buffer (containing 20% glycerol) pH ~ 7.9, I = 0.1, at 20.0 °C. The rotor speed was 40,000 rpm. The profile for 12.8 μM vancomycin is shown (grey line). VanS and vancomycin is shown by the red line under the same conditions. b (leftmost): VanS (9 μM) difference CD spectrum (solid black line); VanS in the presence of 5-fold vancomycin (45 μM) difference spectrum (dashed black line); (rightmost): vancomycin (45 μM) difference spectrum. Reactions contained 10 mM HEPES, 20% (v/v) glycerol, 100 mM NaCl and 0.05% n-dodecyl-β-D-maltoside, pH 7.9. Unsmoothed data shown. Both panels reproduced with permission from Phillips-Jones et al. (2017b)

