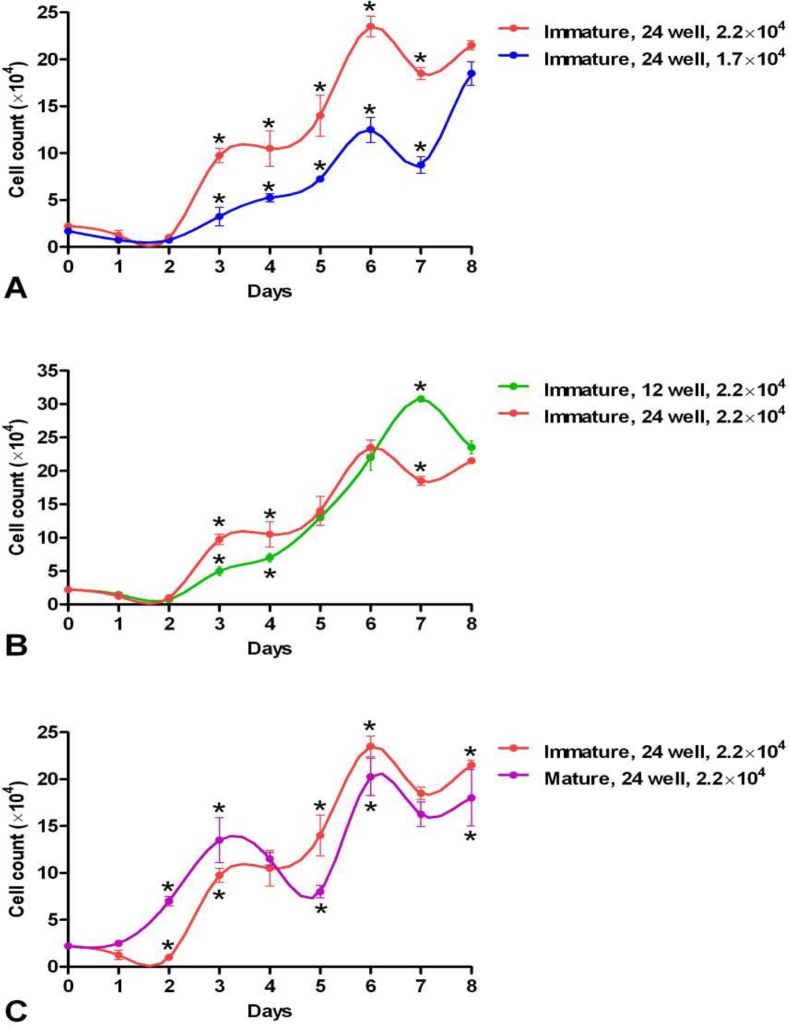
Figure 5.
Comparisons of the growth curves of endometrial mesenchymal stem stromal cells A) in immature ewes seeding different cell numbers (2.2×10⁴ and 1.7×10⁴) at the starting point in 24-well culture plates; B) in immature ewes seeding 2.2×10⁴ cells at the starting point in 12- and 24-well culture plates; and C) between mature and immature ewes when seeding 2.2×10⁴ cells at the starting point in 24-well culture plates. * Stars show significant differences between groups in same days (p<0.05

