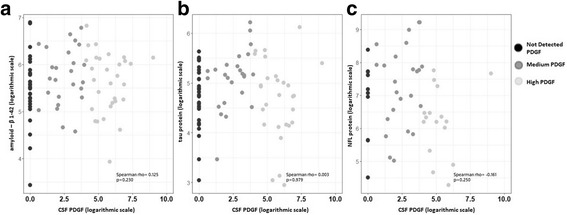
Fig. 2.

CSF PDGF levels and markers of neurodegeneration and axonal damage. The figure shows the correlations between CSF PDGF levels and the levels of amyloid-β 1–42 (a), tau protein (b), and NFL protein (c). To obtain a better graphical representation, all variables are depicted on logarithmic scale. Spearman rho correlations were calculated on the variables’ original scale. No significant correlation was found between CSF PDGF concentrations and the levels of markers of neurodegeneration and axonal damage. The p values showed were not adjusted by the Benjamini–Hochberg FDR controlling procedure
