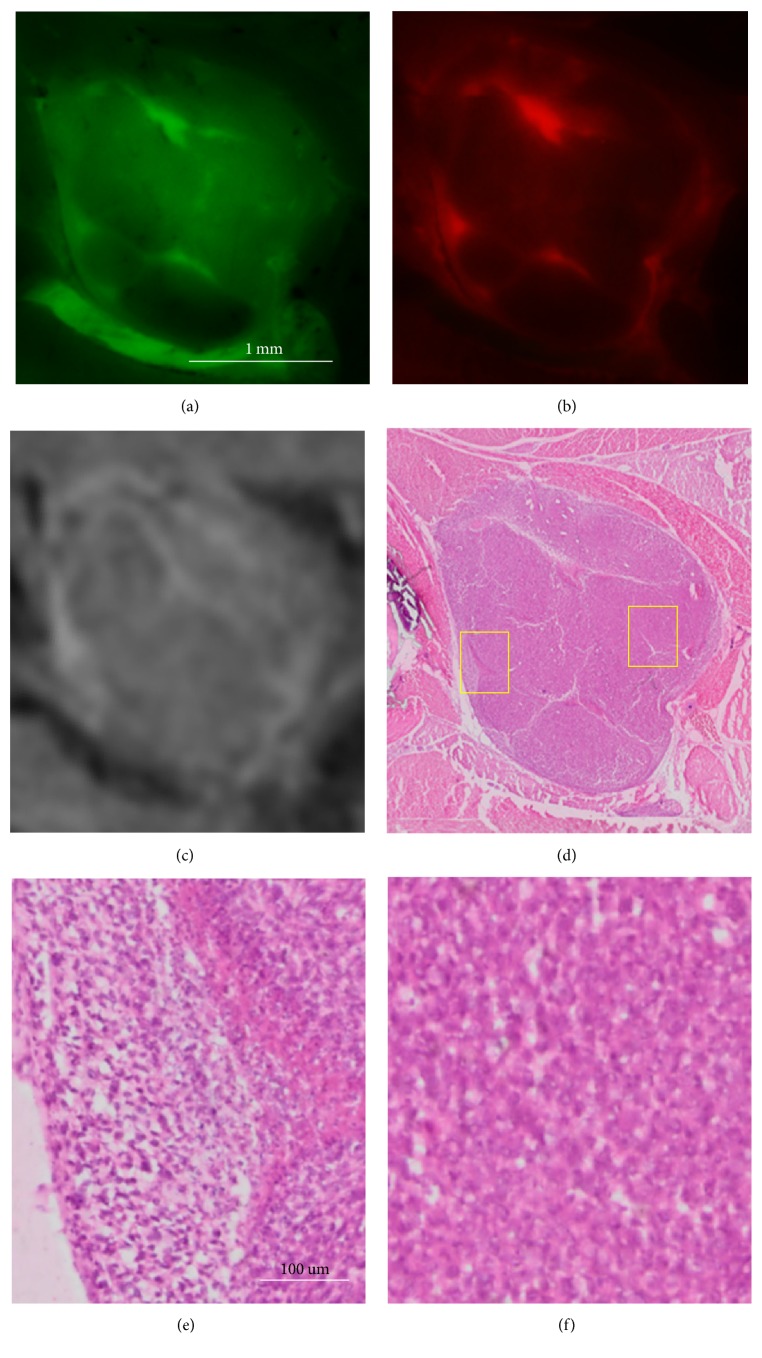
Figure 11.
cryo-imaging and histology of a tumor with inhomogeneous GFP distribution and CREKA-Cy5 and CREKA-Gd labeling. The tumor consisting of green fluorescence GFP, red fluorescence CREKA-Cy5, MRI CREKA-Gd, and histology H&E is shown in (a–d), respectively. Magnified histology images in (e) and (f) are from the left and right regions identified in (d) with high and low labeling, respectively. (e) contains tumor cells and a blood vessel, presumably leading to hyperintense labeling. (f) shows a region of low labeling signal intensity comprised of noncancerous tissue. Scale bar = 100 μm.

