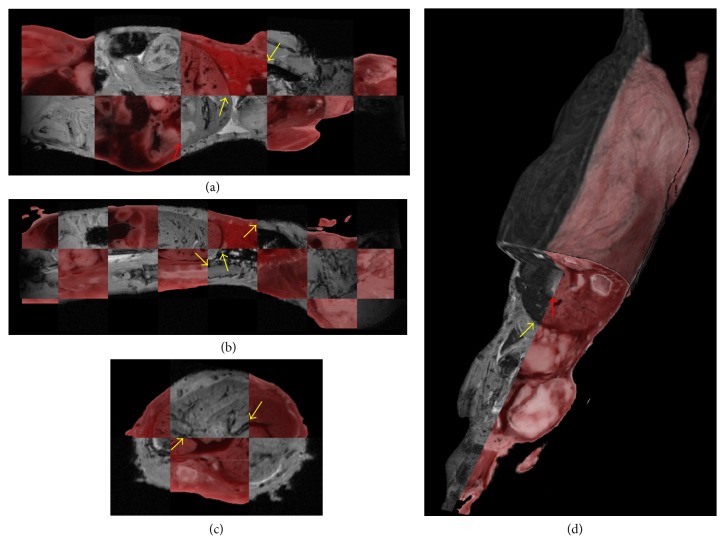
Figure 5.
Visual evaluation of registration quality for whole mouse. Figure shows multiplanar checker board view of registration results. In (a) yellow arrows point at edges of lungs and liver in XY view; red arrows point at parts of intestine showing misregistration. In (b) arrows point at edges of lungs, liver, and spinal cord in XZ view, and in (c) a blood vessel in liver is shown in YZ view. (d) 3D visualization to assess registration accuracy in 3D. Yellow arrows point at liver edge. Red arrow points at parts of intestines showing misregistration.

