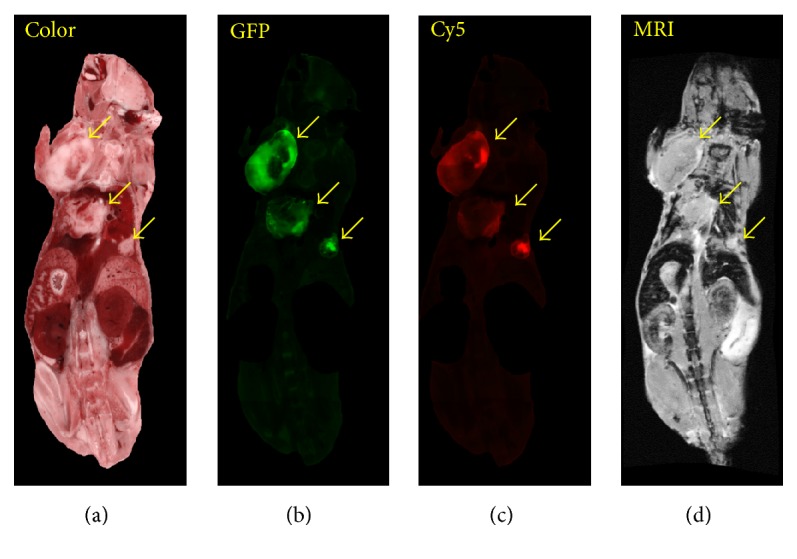
Figure 9.

Multimodality analysis of large metastases targeting. From left to right are color episcopic anatomy, green fluorescence GFP tumor, red fluorescence CREKA-Cy5, and MRI CREKA-Gd. Large tumors (arrows) visible in bright field and GFP images are labeled in Cy5 and MRI images. In these images, we masked out the GI tract and skin, which tend to have a lot of auto fluorescence. The imaging agents tend to label the edges of bigger metastases and all of smaller ones.
