
Figure 2.
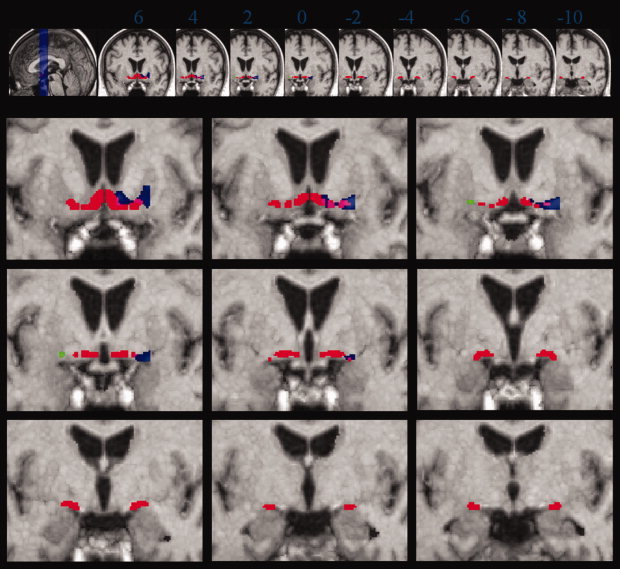
Volume reduction in patients with AD compared to controls, age correction. Coronal sections through the group specific template are from anterior to posterior, 2 mm apart, starting at Talairach‐Tournoux coordinate y = 6. Numbers underneath each slice in the upper row indicate the level of the coronal section in Talairach‐Tournoux coordinate y. Left of image is left of brain (view from posterior). Red: localization of the postmortem map of basal forebrain cholinergic nuclei in MNI space. Blue: volume reductions in patients with AD compared to controls in the right hemisphere. Green: volume reductions in patients with AD compared to controls in the left hemisphere. Overlapping voxels between the effects of volume reduction and the localization of the postmortem map are indicated in pink (right hemisphere) and yellow (left hemisphere), respectively. Voxel are shown passing the height threshold P < 0.01, uncorrected for multiple comparisons. The cluster extension, representing the number of contiguous voxels was set at ≥5.