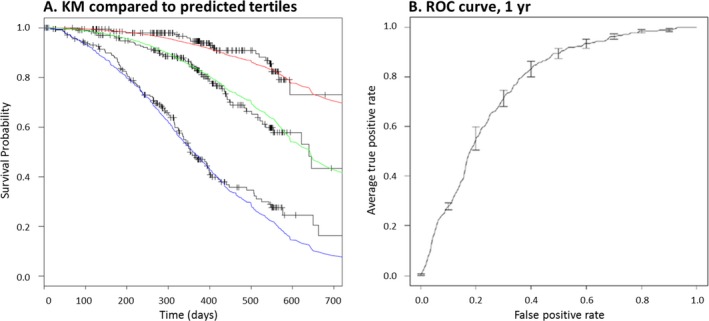
Figure 2.

Model performance evaluated on a validation dataset. (A) Survival model accuracy was evaluated on the ability of the predictions to accurately stratify into low, medium, and high mortality risk groups, as well as by evaluating the degree of agreement between the predicted survival curves of each of these three groups (red, green, and blue curves) and the observed Kaplan–Meier curves (black stepwise curves). (B) A global evaluation of model performance is performed by plotting the average ROC curve across all folds of the internal tenfold cross‐validation (2B).
