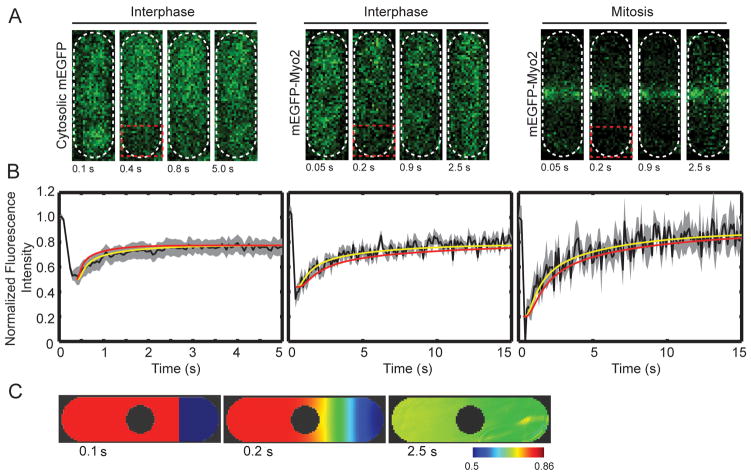
Figure 2.
FRAP of live cells.(A) Time series of images of cells from FRAP experiments. Each image is of 4 μm thick confocal section, including all the fluorescence in the cell. Left, cell expressing mEGFP; middle, interphase cell expressing mEGFP-Myo2; right, mitotic cell expressing mEGFP-Myo2. Red box indicates area of cells that was photobleached. (B) Averaged time courses of the recovery of fluorescence in the bleached zone (black lines): Left, mEGFP (n = 9 cells), middle, mEGFP-Myo2 in interphase (n = 8 cells) and right, mEGFP-Myo2 in mitotic phase (n = 8 cells). The grey areas show the standard error of the mean. Yellow lines are the time courses of recovery simulated by Vcell with diffusion coefficients of 22 μm2/s (mEGFP), 3.0 μm2/s (mEGFP-Myo2 in interphase) and 2.5 μm2/s (mEGFP-Myo2 in mitosis). Red lines are time courses of recovery calculated by Vcell using diffusion coefficients from FCS experiments. (C) Time course of fluorescence fluctuations in the contractile ring in a cell expressing mEGFP-Myo2, after photobleaching the tip of the cell. (D) Vcell model of time course of the recovery from photobleaching of mEGFP in the first frame (0.1 s). The second frame is time 0.2 s. The third frame is time 2.5 s. These images are sections through the mid plane of the cell. The pseudo-color scale gives the concentrations in μM used in the Vcell model based on the normalized fluorescence intensity in FRAP experiments.

