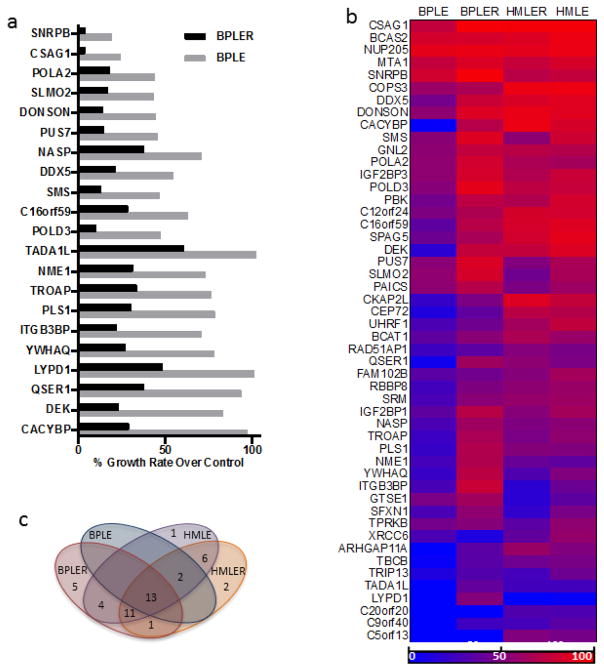
Figure 1.
Growth screen for 50 stem cell cancer candidate gene produces by siRNA screening. (a) The 21 gene targets that resulted in significant growth inhibition in BPLER compared to BPLE. (b) heat map showing growth inhibition of all 4 cell lines. Growth inhibition is measured relative that of non-targeting control siRNA wells for each cell line. 100% (bright red) is complete growth inhibition and 0% (bright blue) is no growth inhibition. (c) VENN diagram showing numbers and overlap of genes that induced growth inhibition by more than 50% in each cell line.

