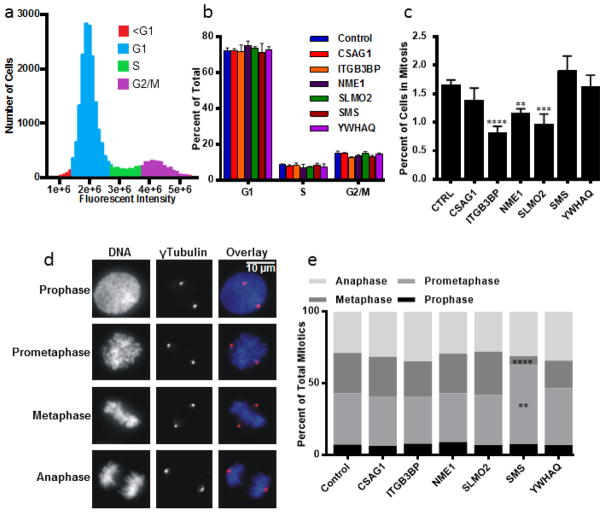
Figure 2.
Cell Cycle alteration testing by siRNA in BPLER cells for 6 selected genes. (a) Cell cycle profile of control BPLER cells. (b) Percentages of cells in each phase of the cell cycle for indicated siRNA depletions. Intensity gates for scoring cells in G1, S, G2/M were established in control BPLER cells and applied to each of the experimental sets. No significant changes were observed in the proportion of cells in any cell cycle phase. (c) Mitotic indices. ITGB3BP (p = 0.0001), NME1 (p = 0.0019) and SLMO2 (p = 0.0002) depletions resulted in significant decreases of mitotic index. (d) At least 200 mitotic cells from each of 4 experiments were counted (n>800) and classified into 4 categories: prophase, cells with an intact nuclear envelope and condensed chromosomes; prometaphase, cells after nuclear envelope breakdown and before formation of the metaphase plate, metaphase, cells having all chromosomes aligned at the metaphase plate, and anaphase, cells with separated chromatids before nuclear reformation. (e) Proportion of cells at each phase of mitosis. Numbers represent the percentage of total mitotic cells (n>800). Prometaphase cells were increased (p = 0.0012) and metaphase cells decreased (p = 0.0001) after depletion of SMS. Significance was determined using one-way ANOVA and adjusted for multiple testing using the Dunnett method of statistical hypothesis testing [39]. Note: asterisks correspond to alpha level (*p < 0.05. **p < 0.01. ***p < 0.001. **** p < 0.0001) Error bars represent standard deviation from 4 separate experiments.

