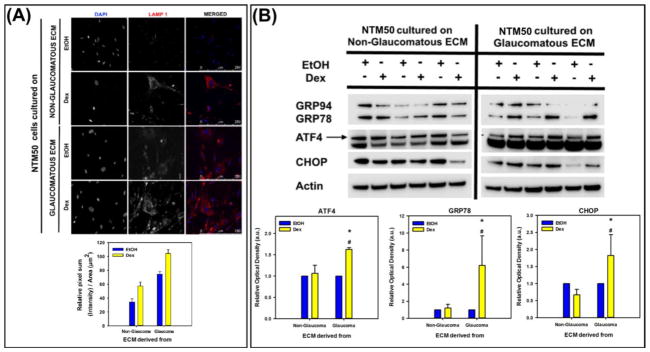
Figure 7.
(A) LAMP1 expression (red) was observed to be greater, and (B) endoplasmic reticular stress markers (ATF4, GRP78, and CHOP) were overexpressed in NTM50 cultured on glaucomatous ECM. Graph is the quantification of relative optical density of αSMA protein band normalized to β-actin. *p<0.05, t-test compared with vehicle control (EtOH), and *p<0.05, t-test compared with non-glaucomatous group.

