
Figure 5.
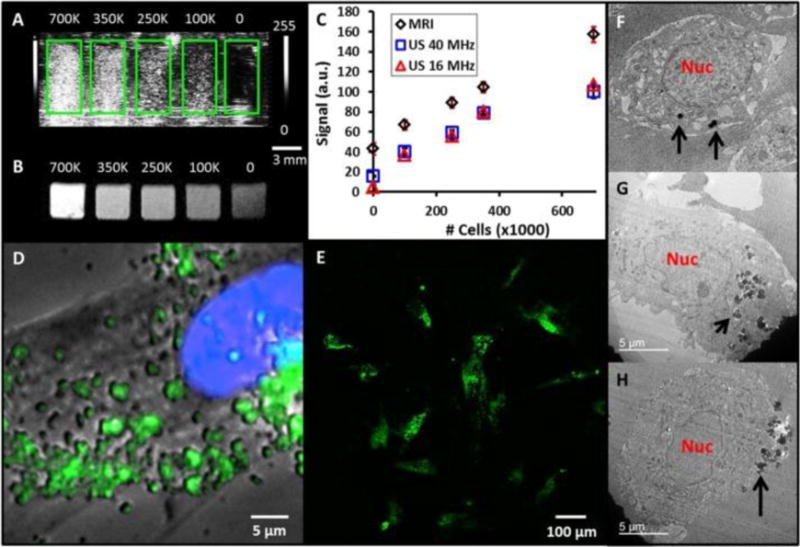
(A) Coronal view of 40 MHz ultrasound imaging of decreasing number of MSNs-labeled mesenchymal stem cells (MSCs). Green boxes outline the boundaries of wells in the phantom. (B) Transverse view from T1-weighted MRI of the same cell sample. Scale bar and intensity bar to the right of A apply to both panels. (C) Dose response curves for increasing numbers of cells shows linear relationships at R2 >0.97 for both MRI and ultrasound (US). (D) Epifluoresence microscopy with MSCs nucleus in blue and MSNs fluorescently tagged in green. Punctate areas are seen indicating endosomal accumulation of MSNs. (E) Confocal microscopy image indicating that the MSNs are located both on the cell periphery and interior. Panels (F-H) are three representative TEM images of MSCs labeled with MSNs. Note that the MSNs are located both on the cell periphery (F, H) and interior (G). Nuc: nucleus; Black arrows: MSNs. Reproduced with permission113.