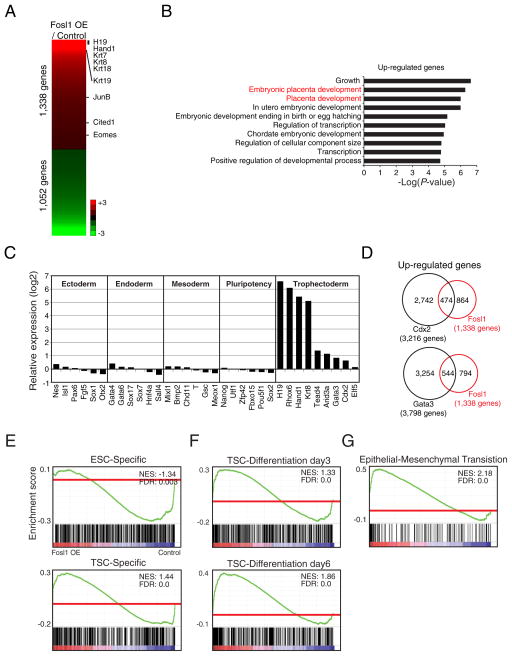
Fig. 2.
Global expression profiling reveals that Fosl1 OE induces genes implicated in the later stage of TE differentiation. A) Heatmap showing numbers of genes that are up- and down-regulated upon OE of Fosl1 in ES cells. Several TE lineage-specific genes are shown in the right side of the heatmap. B) Bar graphs presenting the enriched Gene Ontology (GO) terms of biological processes in up-regulated genes of Fosl1 OE cells. C) Relative transcript levels of various markers of lineages and pluripotency factors in Fosl1 OE cells to control cells. D) Venn diagrams showing overlaps of up-regulated genes between Fosl1 OE cells and Cdx2-OE cells (upper panel) or Gata3-OE cells (bottom panel). E–G) Gene Set Enrichment Analysis (GSEA) showing enrichment of gene sets such as ESC-specific genes as well as TSC-specific genes (E), active genes in differentiated TS cells (for 3 and 6 days) (F), and epithelial-mesenchymal transition in Fosl1- OE cells over control ES cells.

