
Figure 5. NEFA following a single dose of Kme supplement or placebo.
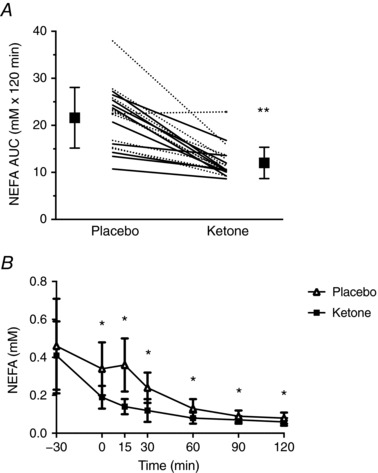
Supplements were consumed in the fasted state followed 30 min later by a 75 g OGTT. A, NEFA response over time. B, 2 h AUC. Continuous lines represent individual male participants and dashed lines represent individual female participants. ** P < 0.001 vs. placebo. * P < 0.01 vs. placebo within time point, Bonferroni adjusted post hoc.