
Figure 1. LPS stimulates DLL4 expression in HPMECs and mouse lung.
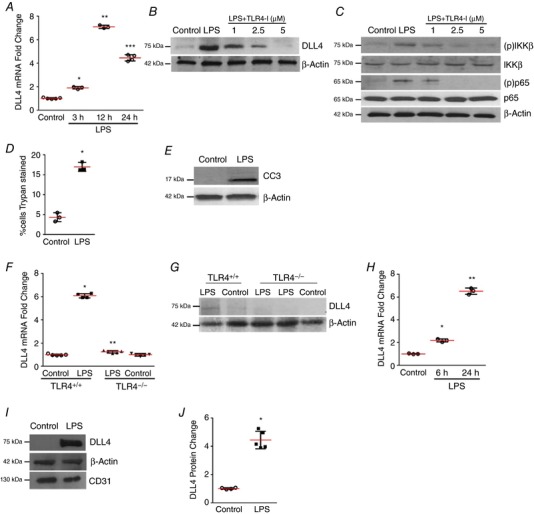
A, HPMEC RNA obtained at 3, 12 and 24 h after LPS was used to quantify DLL4 expression by qRT‐PCR, P < 0.01 (Control vs. LPS at 3 h*, 12 h** and 24 h***), n = 3. B, DLL4 protein in HPMECs was quantified by immunoblotting 24 h after LPS treatment, with or without TLR4‐blocking antibody (TLR4‐I), n ≥ 3. C, DLL4, IKK‐β phosphorylation [(p)IKKβ], and phosphorylated NF‐κB [(p)p65] in HPMECs were quantified 30 min after treatment with LPS, and with or without TLR4‐I, n ≥ 3. D, HPMEC cell death (%) was quantified by Trypan Blue staining 24 h after LPS treatment, P < 0.01 (*Control vs. LPS), n = 3. E, cleaved caspase 3 protein level was quantified by immunoblotting HPMEC lysates 24 h after LPS treatment. F, total RNA obtained from whole lung of 7‐day old TLR4+/+ and TLR4−/− mice 24 h after i.p. saline or i.p. LPS treatment was used to probe DLL4 mRNA expression by qRT‐PCR. Fold change in expression is relative to TLR4+/+ pups with saline injection, P < 0.05 (*TLR4+/+ vs. TLR4+/+ LPS; **TLR4+/+ LPS vs. TLR4−/− LPS), n ≥ 4 mice per group. G, DLL4 protein expression in whole lung lysates of 7‐day old TLR4+/+ and TLR4−/− mice, n ≥ 3. H, DLL4 mRNA was quantified in mouse lung EC isolated at 6 and 24 h after i.p. LPS treatment by qRT‐PCR, P < 0.01 (Control vs. LPS at 6 h* and 24 h**), n ≥ 3 mice per group. I, DLL4 protein expression was quantified in mouse lung EC isolated 24 h after i.p. LPS, with densitometric quantification shown graphically (J), * P < 0.05 (Control vs. LPS), n ≥ 3. [Color figure can be viewed at http://wileyonlinelibrary.com]