
Figure 5. ERK regulates LPS‐induced in vivo angiogenesis in HPMECs.
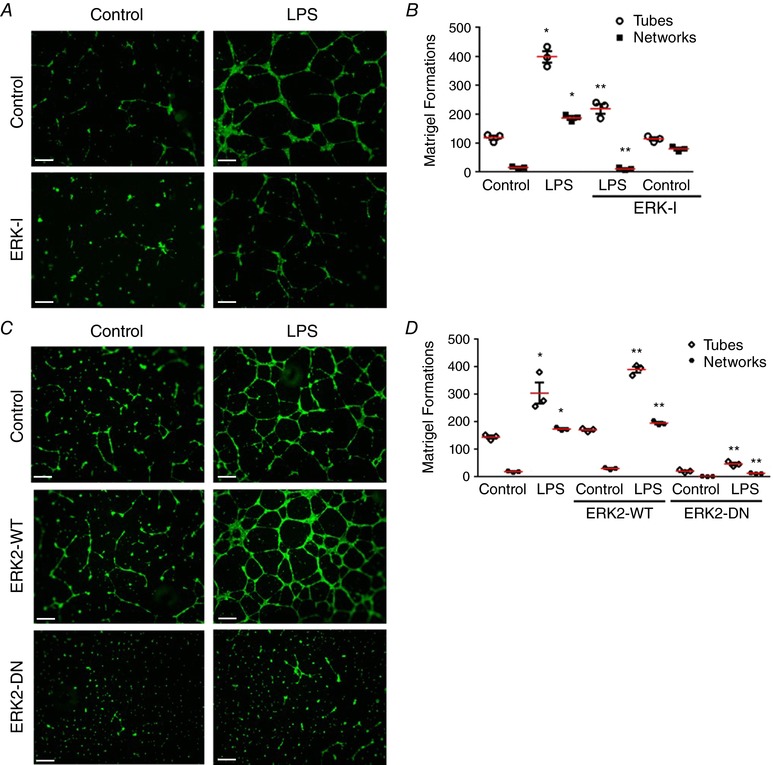
A–D, in vitro angiogenesis was assessed after treatment with LPS, ERK‐I, ERK2‐WT and ERK2‐DN in HPMECs using a Matrigel‐based assay. A and C, fluorescent microscope images depicting angiogenic tube and network formation were captured at 4×. B, graphical representation summarizing data from Fig. 5 A for tube and network formations, P < 0.01 (*Control vs. LPS; **LPS vs. ERK‐I + LPS), n = 3. D, graphical representation summarizing data from Fig. 5 B, P < 0.001 (*Control vs. LPS; **LPS vs. ERK2‐WT+LPS and LPS vs. ERK2‐DN+LPS), n = 3. Scale bar represents 500 μm.