
Figure 8. LPS‐induced stimulation of DLL4 expression during retinal angiogenesis.
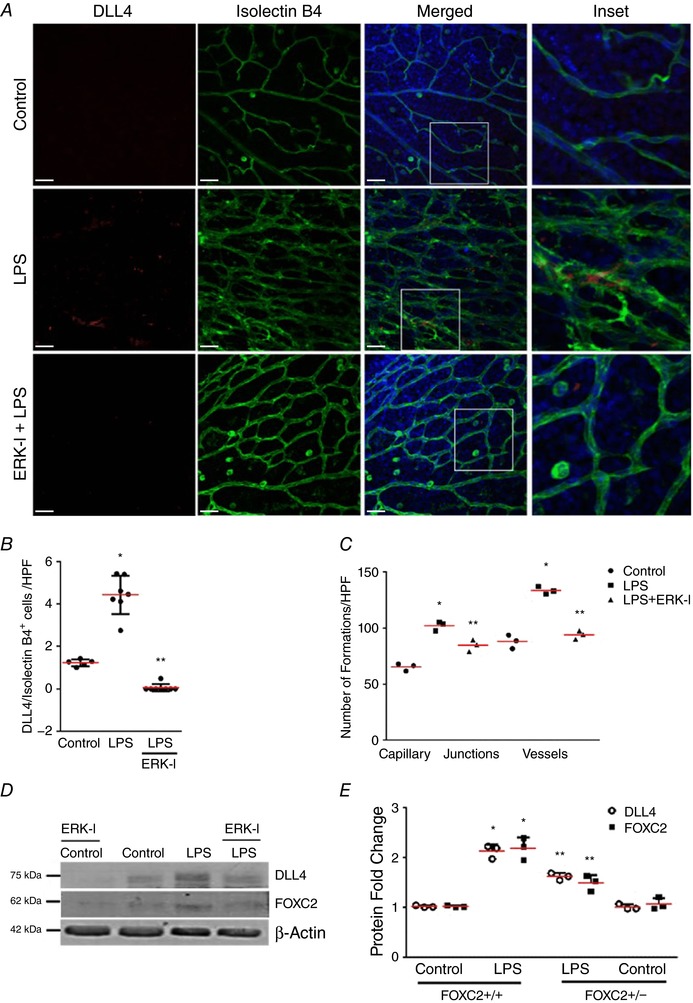
A–C, retinas were extracted from 4‐day‐old mouse pups 24 h following i.p. LPS treatment with or without ERK‐I. A, confocal microscope images of mouse retinas depicting immunofluorescent staining of Isolectin B4 and DLL4 antibody. Isolectin B4 is shown in green, DLL4 is shown in red, and Hoescht (nucleus) is blue. Images were captured at 25×, with the inset being at 63× magnification. B, graph summarizing percentage of DLL4+/IsolectinB4+ cells per high power field (HPF), * P < 0.01 (Control vs. LPS) and ** P < 0.05 (LPS vs. ERK‐I + LPS). C, graph summarizing the number of capillary junctions and vessel count per high power field (HPF), * P < 0.01 (Control vs. LPS) and ** P < 0.05 (LPS vs. ERK‐I + LPS), n ≥ 3 mice in each group. D and E, DLL4 and FOXC2 expression were examined in monkey retinal endothelial cells by immunoblotting lysates 24 h after LPS treatment with or without ERK‐I, with densitometry shown graphically (E), P < 0.01 (*Control vs. LPS; **LPS vs. LPS and ERK‐I), n = 3. Scale bar represents 20 μm.