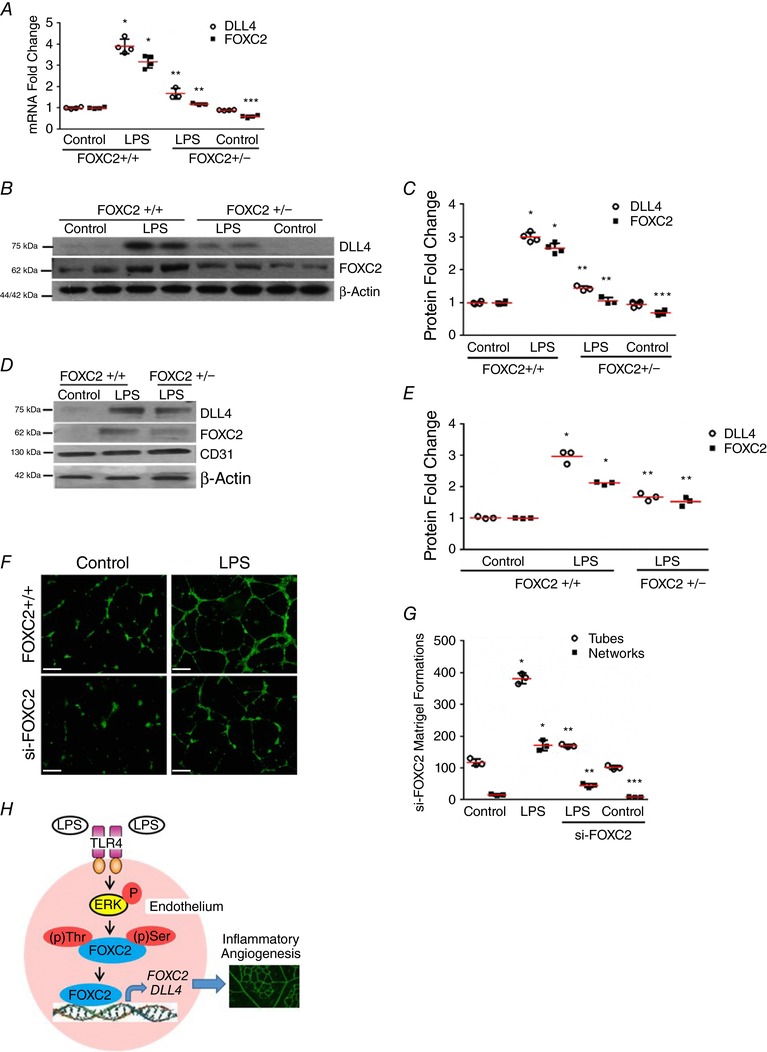
Figure 9. FOXC2 regulates LPS‐induced DLL4 expression in vivo and in vitro angiogenesis.

A–C, lung homogenates obtained from 7‐day mice 24 h after i.p. LPS were used. A, lung RNA was used to quantify DLL4 and FOXC2 expression by qRT‐PCR, P < 0.01 (*FOXC2+/+ vs. FOXC2+/− LPS; **FOXC2+/+ LPS vs. FOXC2+/− LPS; ***FOXC2+/+ Control vs. FOXC2+/− Control), n = 4. B and C, DLL4 and FOXC2 protein were quantified 24 h after LPS treatment, with densitometric quantification shown (C), P < 0.05 (*FOXC2+/+ vs. FOXC2+/+‐ LPS; **FOXC2+/+ LPS vs. FOXC2+/− LPS; ***FOXC2+/+ Control vs. FOXC2+/− Control), n = 4 mice/group. D and E, lung endothelial cells isolated from 7‐day mice 24 h after i.p. LPS were used. D, DLL4 and FOXC2 protein were assessed by immunoblotting, with densitometry quantification shown (E), P < 0.05 (*FOXC2+/+ vs. FOXC2+/+‐ LPS; **FOXC2+/+ LPS vs. FOXC2+/− LPS), n = 3 mice/group. F and G, in vitro angiogenesis was assessed 12 h after LPS in HPMECs treated with si‐FOXC2 or scrambled siRNA. F, fluorescent microscope images depicting angiogenic tube and network formation in Matrigel (4× magnification). G, graphical summary of data for tube and network formations, P < 0.01 (*Control vs. LPS; **LPS vs. siFOXC2 + LPS; ***Control vs. siFOXC2 Control), n = 3. H, cartoon depicting the proposed mechanism underlying LPS‐mediated angiogenesis through endothelial TLR4‐ERK‐FOXC2‐DLL4 signalling in lung EC. Scale bar represents 500 μm.
