
Figure 1. Schematic representation of the experimental site.
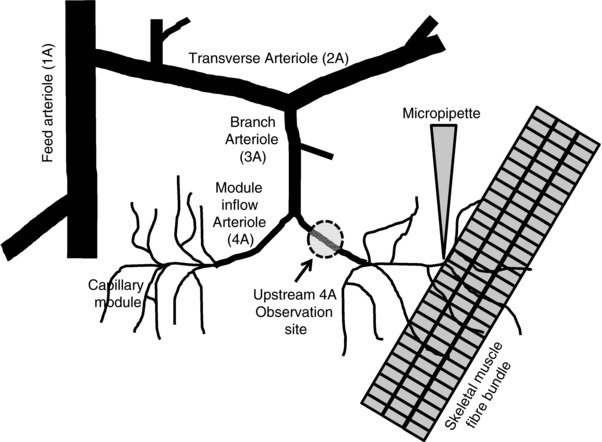
Schematic representation of part of the arteriolar microvascular network (feed arteriole, 1A; transverse arteriole, 2A; branch arteriole, 3A; module inflow arteriole, 4A) and associated capillaries. The diagram indicates the set‐up of different protocols that used capillary stimulation by either micropipette drug application or microelectrode stimulation and the modular inflow (4A) arteriolar observation site. Diagram not drawn to scale.