
Figure 1. Spontaneous intracellular Ca2+ waves in USMCs.
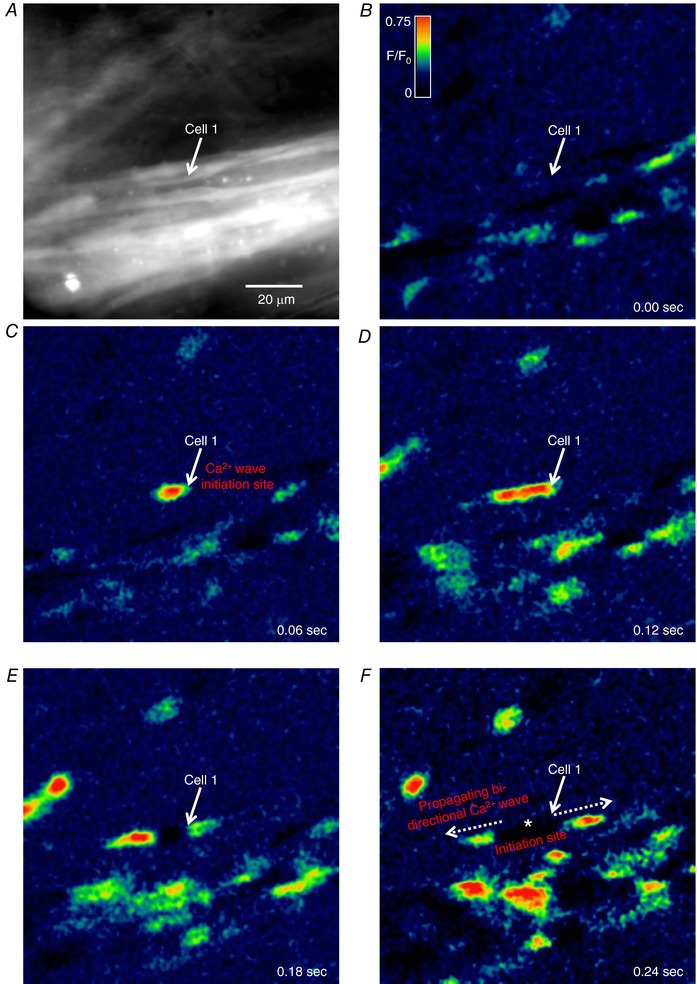
A, representative image of a USMC bundle imaged from a SmMHC‐Cre‐GCaMP3 mouse urethra with a 60× objective. The white arrow highlights a cell of interest. B–F, time‐lapse montage of spontaneous intracellular Ca2+ activity in USMCs in situ with a bi‐directional Ca2+ wave in the highlighted cell emphasized throughout. The initiation site of this Ca2+ wave is indicated in F by the white asterisks. Panels are colour coded as F/F 0 as shown in B.