
Figure 9. The effect of blocking IP3Rs on USMC Ca2+ waves.
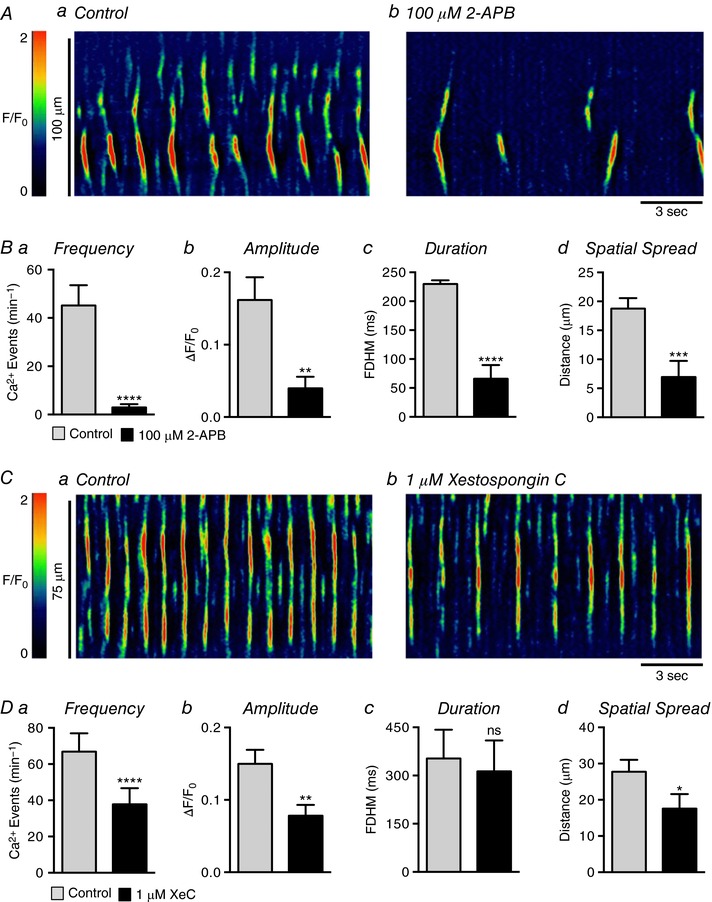
Aa and b, representative ST maps showing the effect of 100 μm 2‐APB on Ca2+ transient firing in USMCs. Ba–d, summary data showing the effect of 100 μm 2‐APB on USMC Ca2+ transient frequency (a), amplitude (b), duration (c) and spatial spread (d) (c = 19, n = 6). Ca and b, representative ST maps showing the effect of 1 μm xestospongin C (XeC) on Ca2+ transient firing in USMCs. Da–d, summary data showing the effect of XeC on USMC Ca2+ transient frequency (a), amplitude (b), duration (c) and spatial spread (d) (c = 20, n = 5). ns, not significant, * p < 0.05, ** p < 0.01, *** p < 0.001, **** p < 0.0001.