FIGURE 1.

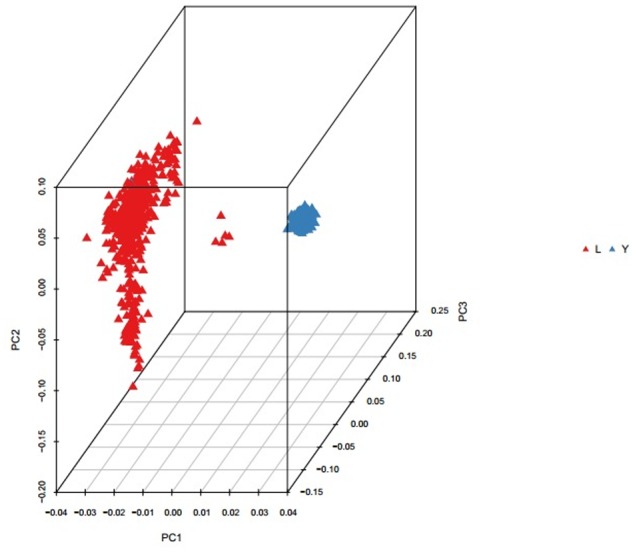
Principal component analysis results based on whole genome SNP data. The red represents the Landrace pigs and the blue represents the Yorkshire pigs.

Principal component analysis results based on whole genome SNP data. The red represents the Landrace pigs and the blue represents the Yorkshire pigs.