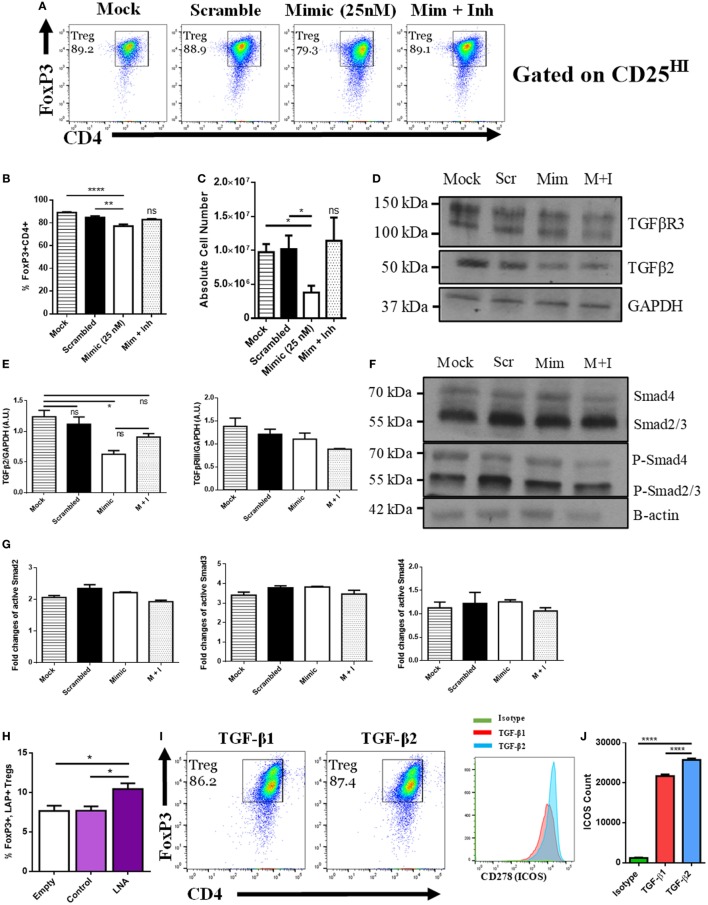
Figure 3.
MicroRNA (miRNA) 466a-3p transfection inhibits regulatory T cell (Treg) polarization. Purified naïve CD4+ T cells were cultured under Treg-polarizing conditions along with the indicated mimic, control, or inhibitor conditions. Cells were harvested 48 h after addition of cytokines and miRNA mimics, inhibitors, or controls and subject to flow cytometry, immunoblot and quantitative real-time-PCR. The success of Treg polarization is examined as (A) representative dot plots gated on CD25HI cells and quantified in (B,C). Representative immunoblots of indicated proteins are presented in (D,F), along with associated densitometric measurements of transforming growth factor-beta 2 (TGF-β2) and TGF-βR3 (E), and quantification of activated Smad 2, 3, and 4 (G). CD4+ cells were purified from naïve mouse lymph nodes and stimulated ex vivo with CD3 (3 µg/mL) and CD28 (3 µg/mL) for 48 h and administered Locked Nucleic Acid or controls at the time of seeding. Quantification of flow cytometry data from LAP-expressing FoxP3 positive Treg cells. (H) Purified naïve CD4+ T cells were cultured with either TGF-β1 (5 ng/mL) or TGF-β2 (5 ng/mL), along with CD3 (3 µg/mL), CD28 (3 µg/mL), and IL-2 (5 ng/mL) for 5 days. (I) representative dot plots of FoxP3, CD4-positive Tregs gated on CD25HI, (J), and their associated CD278 (ICOS) expression. Data are presented as mean ± SEM of three independent transfection experiments. *P < 0.05, **P < 0.005, ****P < 0.0001 by ANOVA with Tukey’s multiple comparison test.

